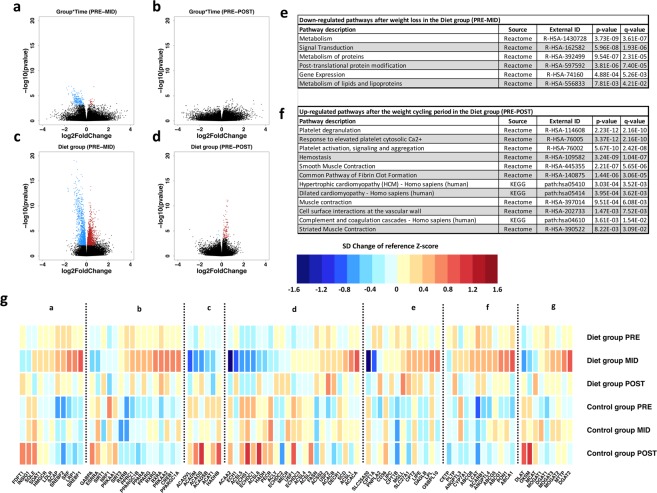
Figure 3.
Volcano plots and most significant pathways of gene-level differential expression analysis results. Volcano plots in panels a and b represent Wald test contrast results from time-point interval comparisons between diet and control groups. Panels c and d depict results from diet group only analysis. Differentially expressed genes (DEGs) with statistically significant P values (false discovery rate, FDR < 0.05) (y-axis); blue indicates down-regulation and red indicates up-regulation. Magnitude of expression change is depicted on the x-axis with log2FoldChange. Panel e shows pathways associated with the 231 down-regulated DEGs from Time*Group interaction after the weight loss period (PRE-MID). No significant up-regulated pathways were found from the 24 up-regulated DEGs of the Time*Group interaction after the same period. Panel f depicts significant up-regulated pathways associated with 82 DEGs (panel d) affected by the whole weight cycling period in the diet group (PRE-POST) – although these genes were affected only by the weight regain period, not by weight loss. No significant down-regulated pathways were observed from the 5 down-regulated DEGs after the weight cycling period (PRE-POST). In panel g, lipid metabolism-related normalized gene expression levels and color key are represented as standard deviation (SD) change from reference Z-score. Baseline Z-score values (PRE) calculated from both diet and control group were pooled together and set as a reference level to which each individual group/timepoint level were compared; blue indicates decrease and red indicates increase in expression level compared to the reference value. a = Cholesterol synthesis, b = Energy metabolism regulation, c = Fatty acid oxidation, d = Fatty acid synthesis, e = Fatty acid mobilization and transport, f = HDL associated genes, and g = mono-, di-, triglyceride synthesis.

