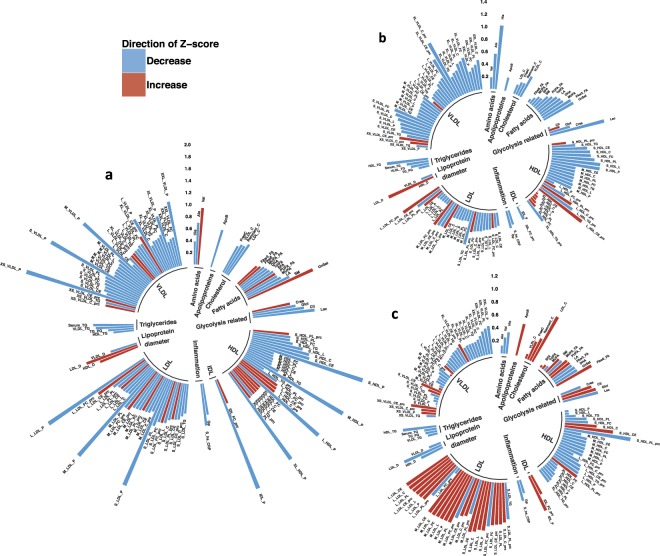
Figure 4.
Polar bar plots of metabolome differences across physique and FINRISK participants. 129 health-related biomarkers that differed between the physique and FINRISK groups were plotted to demonstrate how general population metabolite profile (i) is altered compared to the physique athletes, and (ii) how metabolome profile is affected by weight gain and weight loss in this subsample of individuals from the general population. Polar plots are derived from metabolite raw-values (excluding outliers that were 4 standard deviation (SD) from the mean). Metabolite values are plotted as SD change from the reference Z-score. Red indicates increase and blue indicates decrease compared to the reference Z-score. Lipoprotein subclasses are further ordered according to size in a clockwise direction. Panel a. Physique athletes (diet and control group, n = 42) were pooled together at baseline to increase sample size when compared to age- and BMI-matched general population FINRISK individuals (n = 58). Metabolite values of FINRISK individuals were set as reference Z-score to which physique athletes were compared. A subset of these previously normal-weight FINRISK individuals who lost weight (n = 7, panel b) and gained weight (n = 13, panel c) during a 7-year follow-up was explored to determine if metabolome profile – including these 129 metabolites – was affected in similar manner as in the physique athletes after weight loss and weight gain. FINRISK individual baseline information (2007) was set as the reference Z-score to which the follow-up metabolome profile of 2014 was compared (panels b and c).

