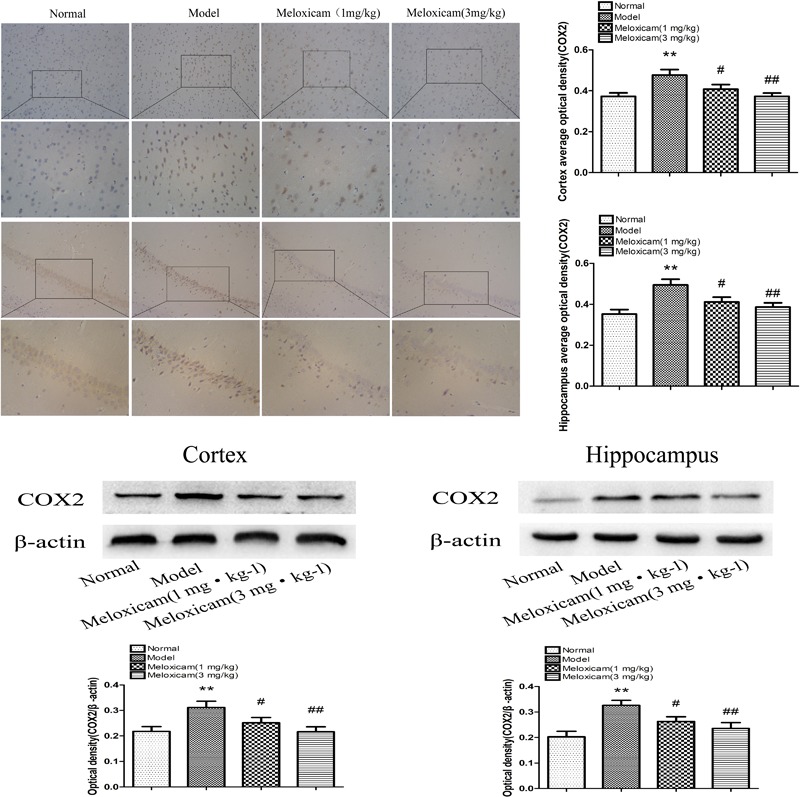
FIGURE 5.

Changes of COX2 expression in T2DM rat cortex and hippocampus (×200, ×400). Compared with normal group, the COX2 expression in cortex and hippocampus were significantly increased compared with normal group. The COX2 inhibitor significantly reversed the increased of cortex and hippocampus COX2 expression. Data are expressed as the mean ± SD for three (IHC) and four (WB) individual rats in each group, and were analyzed statistically using one-way ANOVA, followed by post hoc Tukey’s test. ∗∗P < 0.01 compared with normal group; #P < 0.05 and ##P < 0.01 compared with model group, respectively.
