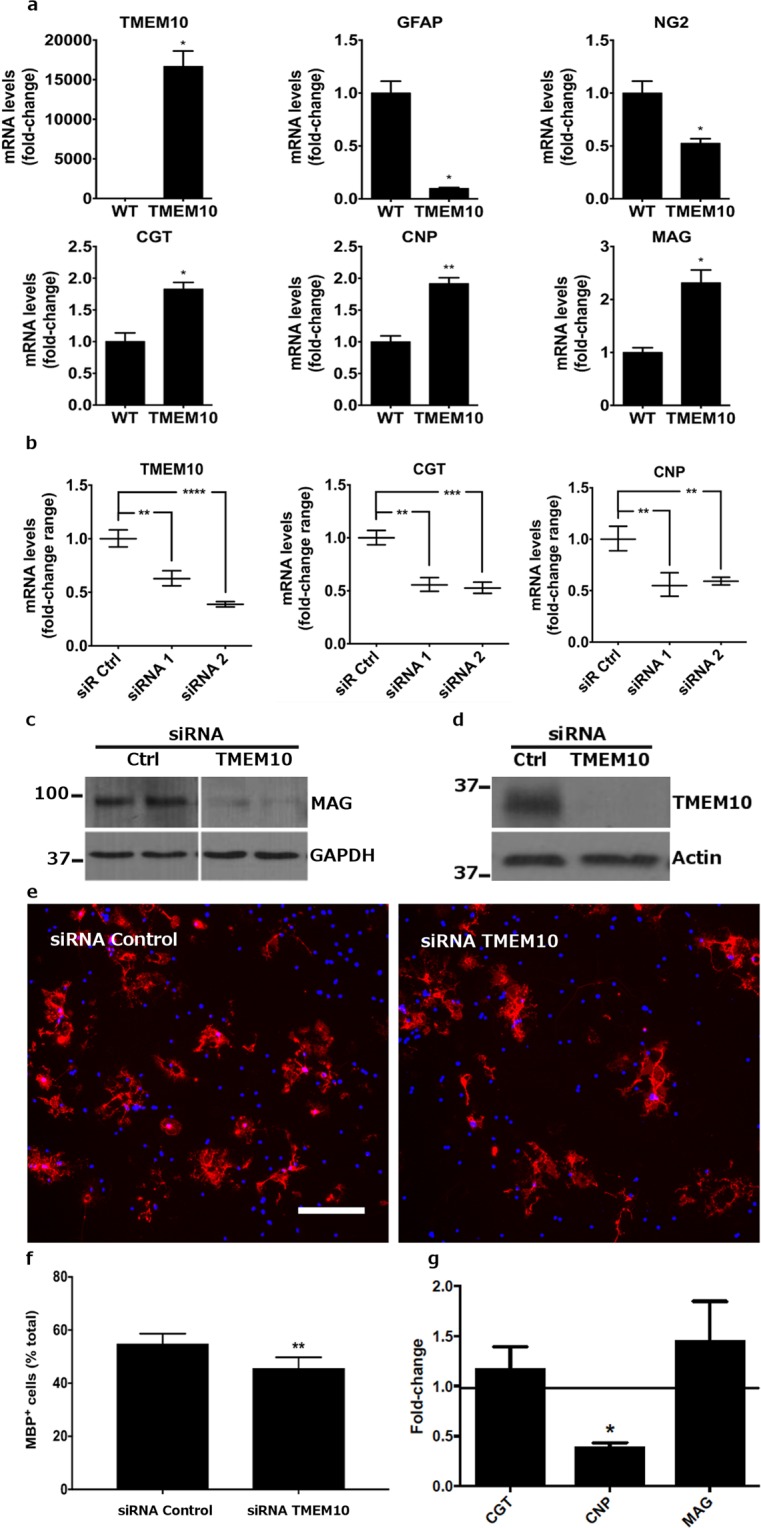
Figure 2.

TMEM10 promotes myelin gene expression – (a) qPCR analysis of lysates derived from WT and TMEM10 Oli-neu cells. Graphs show mean ± SEM. *p < 0.05; **p < 0.01 (Student’s t-test). (b) Oli-neu cells were transfected with control or TMEM10 siRNA and induced to differentiate. qPCR analysis shows reduced levels of CNP and CGT transcripts following TMEM10 knock down. Two experiments, performed in duplicate and analyzed by semi-quantitative RT-PCR, were confirmed in a third independent experiment analyzed by qPCR (shown here). Graphs show mean ± SEM. *p < 0.05 (Student’s t-test). (c) Oli-neu cells were transfected as in (b) and protein in whole cell lysates examined by western bot analysis for MAG expression. The blot is representative of 2 independent experiments. (d) Primary OPCs were electroporated with control and TMEM10 siRNA and cultured for 5 days in differentiating medium. Western blot analysis of protein lysates show TMEM10 knock down. (e,f) The percentage of MBP positive cells relative to the total number of DAPI-positive nuclei was scored. Scale bar: 35 µm. Twelve independent experiments, performed in triplicate, were analyzed. Graph shows mean ± SEM. ** p < 0.01 (paired Student’s t-test). (g) mRNA levels for myelin associated genes following TMEM10 knock down in OPCs were analysed by qPCR. Graph shows fold-change expression. *p < 0.05 (paired Student’s t-test, 2–3 independent experiments).
