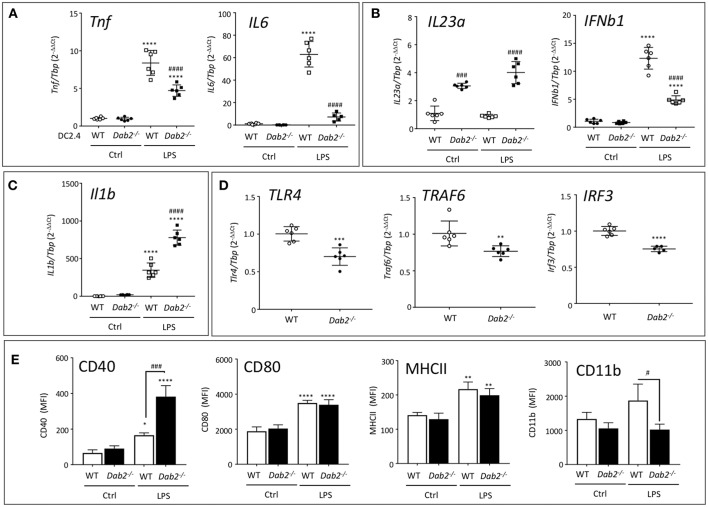
Figure 9.
DAB2 expression modulates DC response to TLR activation. mRNA expression of (A) Tnf and Il6, (B) Il23a and Ifnβ1, (C) Il1β, and (D) Tlr4, Traf6, and Irf3 6 h after exposure of DC2.4WT or DC2.4Dab2−/− cells to 100 ng/mL LPS, evaluated by qRT-PCR with Tbp used as an internal control. (E) Expression of cell surface DC activation markers CD40, CD80, MHCII, and CD11b in DC2.4WT vs. DC2.4Dab2−/− cells treated with vehicle (Ctrl) or 100 ng/mL LPS for 24 h was evaluated by flow cytometry and expressed as mean fluorescence intensity (MFI). Data represent mean values of n = 3–6. (*p < 0.05, **p < 0.01, ***p < 0.05 and ****p < 0.001 Ctrl vs. LPS for DC2.4WT or DC2.4Dab2−/− cells. #p < 0.05 and ###p < 0.005, ####p < 0.001 when DC2.4WT vs. DC2.4Dab2−/− cells in the same treatment groups).

