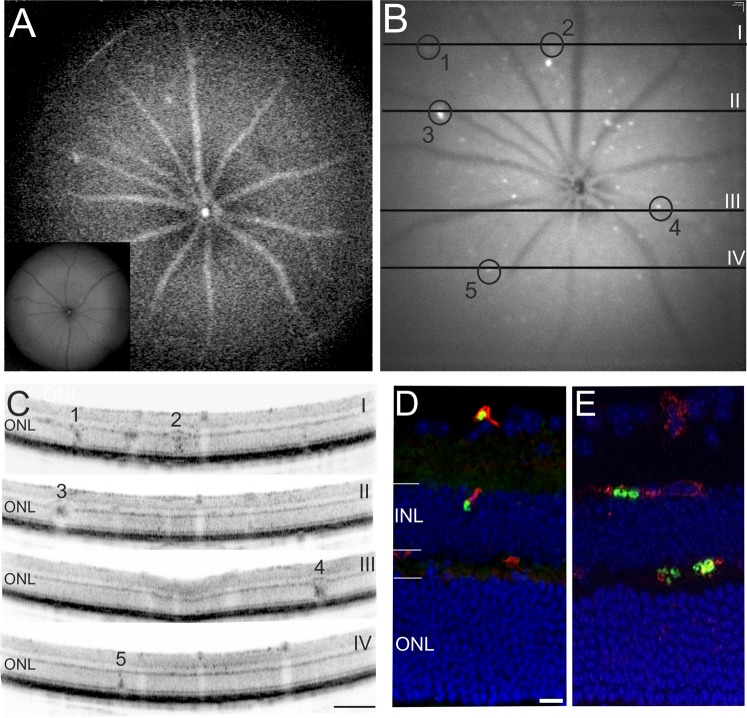
Figure 2.
In vivo and ex vivo detection of GFP-labelled P. berghei in the retina. (A–C) in vivo imaging of a representative animal at 3DPI. (A) SLO AF mode (overview) visualized plasmodia flowing in the blood stream of the large retinal vessels and capillaries (inset: uninfected wild-type). (B) SLO AF mode with focus into deeper retinal layers detected clusters of GFP expressing parasites inside the retina. Regions of interest (ROI) are denoted by black circles. The lines depict the position of the OCT sections. (C) OCT sections with correspondingly numbered ROI visualizing sequestration of parasites. (D,E) Histological sections detected GFP expressing clusters of plasmodia (green) that colocalized with vascular CF8 staining (red). DAPI (blue) was used as nuclear counterstain. Scale bar in C = 200 µm; D = 20 µm.

