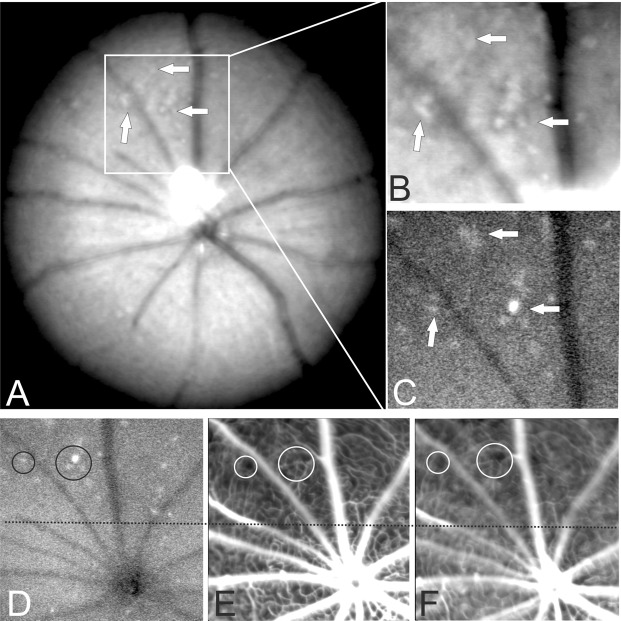
Figure 3.
In vivo SLO imaging directly correlates altered retinal morphology with presence of plasmodia. (A) Native fundus imaging at 3DPI. (B) Magnification. (C,D) AF mode detecting GFP expressing plasmodia. (E) Fluorescein angiography, (F) Indocyanine green angiography. Areas of retinal whitening (arrows in A, 20° fundus overview and B, magnification) could directly be correlated to the presence of GFP expressing plasmodia (arrows in C). Several sites of capillary non-perfusion (CNP) were detected by angiography (E, fluorescein and F, indocyanine green) that could directly be correlated to the plasmodia (examples are denoted by circles in D–F) and the areas of retinal whitening (A,B). The numerous sites of CNP accumulated to a large area of reduced tissue perfusion affecting a considerable part of the visible fundus (above the dotted line in D–F).

