Figure 8.
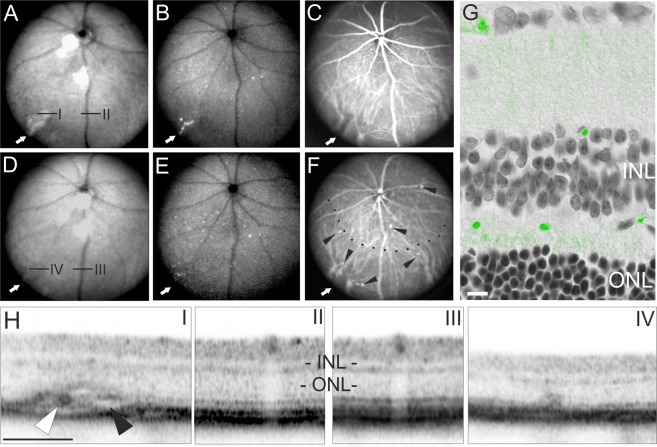
Longitudinal analysis of malaria retinopathy during treatment with DHA. (A–F) SLO imaging: (A,D) in RF mode, (B,E) GFP detection in AF mode, (C,F) ICG angiography. ROIs (I–IV); (G) histological section. (H) OCT sections corresponding to ROIs in the SLO images. ROIs I, IV show infected areas, while ROIs II, III show unaffected regions with healthy fundus appearance in SLO and normal retinal layering as assessed by OCT. (A–C, H I and II) show the analysis at 10DPI (i.e. after 4 days of DHA treatment). (D–G, H III and IV) show the 18DPI time point (12 days of treatment). Scale bars in G = 20 µm; H = 200 µm.

