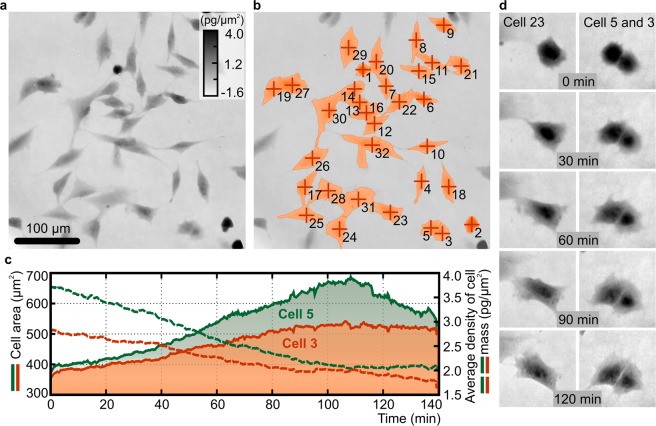
Figure 4.
Time-lapse imaging of live LW3K12 cells and monitoring of area and average density of cell dry mass. (a) Representative image chosen from 140-minute-long experiment. (b) Illustration of cell segmentation used for post-processing of measured data. (c) Quantitative evaluation of cell area and average density of cell dry mass for cell 3 (red color) and 5 (green color). Solid and dashed lines represent areas occupied by cells and average density of cell dry mass, respectively. The measurement was performed with time step 20 seconds. Images are shown in units of pg/µm2 recalculated from phase in radians according to Davies30. (d) Representative images of selected cells during the measured period.

