Figure 6.
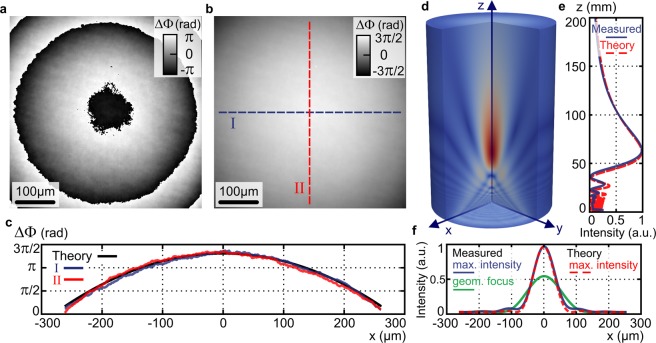
Q4GOM in quantitative restoration of the geometric phase of a polarization directed flat lens. (a) Restored raw geometric phase mapping phase variations at the plane of the polarization directed flat lens. (b) Unwrapped phase from (a). (c) Phase profiles along the cross sections I (blue) and II (red) compared with theoretical phase profile (black) created for the focal length f = 100 mm. (d) 3D amplitude distribution of the focused field calculated from the reconstructed geometric phase. (e) Experimental axial intensity obtained from 3D amplitude distribution in (d) (blue) and theoretical intensity profile for diffraction limited lens (red). (f) Experimental (blue) and theoretical (red) transverse intensity profiles at the plane of maximum axial intensity and experimental transverse intensity profile at the paraxial focal plane (green).

