Figure 2.
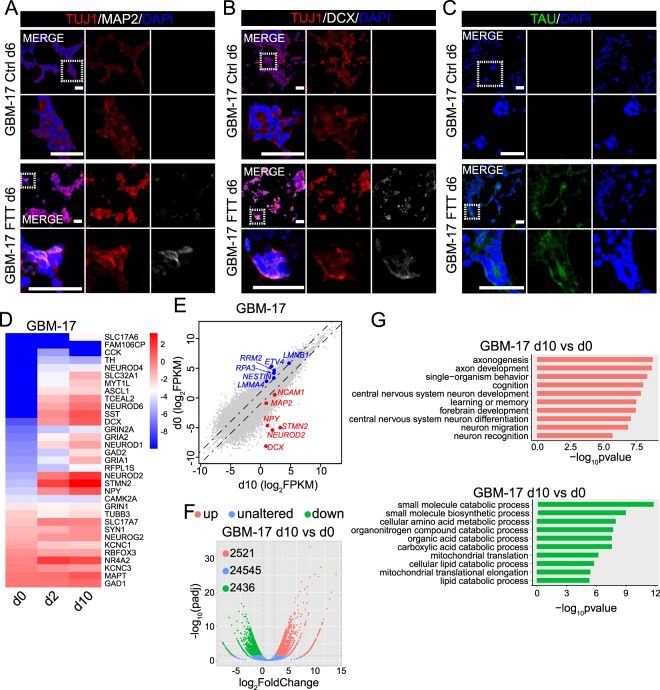
FTT cocktail also induced serum-free cultured GBM cells toward a neuronal fate. (A–C) Immunostaining of TUJ1 (A,B), MAP2 (A), DCX (B), and TAU (C) on GBM-17 cells without or with FTT treatment on day 6. Representative results of n = 3 independent experiments are shown. Scale bar, 50 μm. (D) Heatmap showing the expression of neuronal genes on starting GBM cells (d0), and GBM cells with FTT treatment for 2 days (d2) or 10 days (d10). (E) Scatter plots comparing gene expression levels between GBM-17 cells with FTT treatment for 10 days (d10) and starting cells (d0). Neuronal genes are highlighted in red and GBM genes in blue. Dashed line indicates a 2-fold change. (F) Volcano plots showing the gene expression changes between GBM cells with FTT treatment for 10 days (d10) and starting GBM cells (d0). The dashed vertical and horizontal lines reflect the filter criteria (log2(FoldChange) = ±1.0 and padj = 0.05). The upregulated, unaltered, and downregulated genes are highlighted in light red, blue, and green. The numbers in the upper left corner indicate the number of gene with indicated expression changes. (G) Gene ontology analysis of the upregulated (highlighted in light red) and downregulated (highlighted in light green) genes in F.

