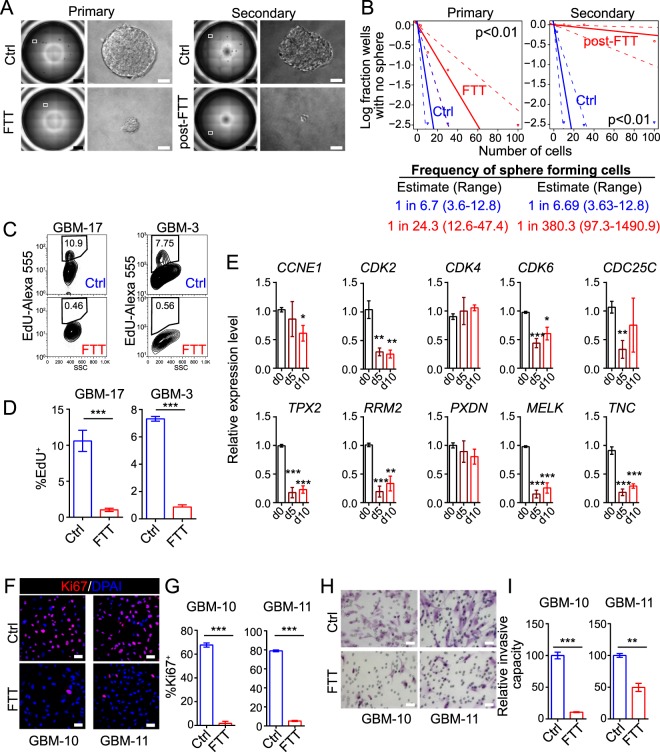
Figure 3.
FTT cocktail attenuated malignant properties of GBM cells in vitro. (A,B) Representative results of primary and secondary sphere formation (A) and extreme limited dilution assay (B) on GBM cells without or with FTT treatment on day 10. A representative well of 96-well plate and a representative sphere are shown in A; scale bar, 1 mm (black), or 50 μm (white). Data in B were analyzed with the online ELDA software and χ2 test. Representative results of n = 3 independent experiments are shown. (C,D) Flow cytometry analysis of EdU incorporation on GBM cells cultured in growth medium without or with FTT treatment for 24 hours. n = 4 and 3 independent experiments for GBM-17 and GBM-3. (E) Analysis of cell cycle associated and GBM enriched genes on GBM-10 cells with FTT treatment for 5 (d5) or 10 (d10) days. n = 4 independent experiments. P values versus d0 were calculated with two-tailed student’s t test. (F,G) Immunostaining of Ki67 on GBM cells without or with FTT treatment for 5 days. n = 3 independent experiments. (H,I) Crystal violet staining of invaded GBM cells without or with FTT treatment for 5 days. n = 3 independent experiments. *p < 0.05; **p < 0.01; ***p < 0.001. Data are represented as mean ± SEM. Two-tailed student’s t test was used to calculate p values in (D,G,I). Scale bar, 50 μm in (F,H).

