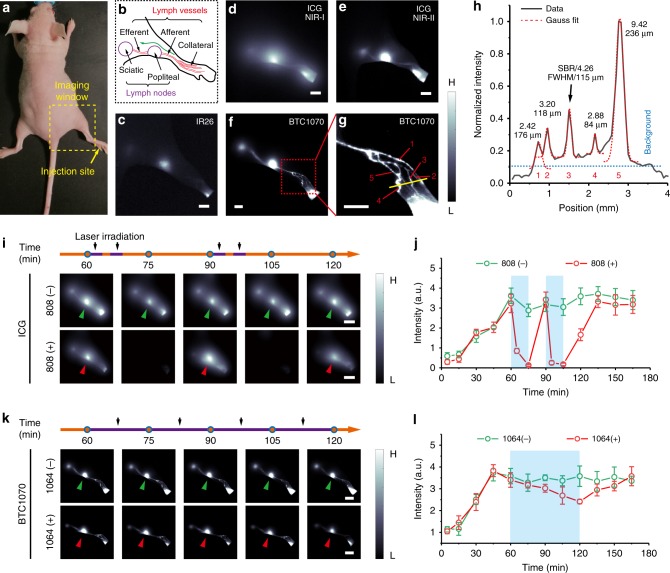
Fig. 4.
Superior lymphatic imaging with BTC1070 to ICG and IR26. a Digital photograph of a nude mouse fixed on imaging plate, showing the injection site (yellow arrow) of contrast agents and the lymphatic drainage imaging window (dash square). b Schematic illustration of the anatomical structure of lymphatic system in the hindlimb of nude mice, green arrow represents the lymphatic drainage from the paw to the sciatic lymph node. c–g Fluorescence images of lymphatic drainage using IR26 c, ICG d, e, and BTC1070 f, g as contrast agents in the hindlimb of nude mice on an InGaAs camera. Scale bar, 2.5 mm. IR26 and BTC1070 imaging signals were collected at wavelength of 1200–1700 nm under 1064 nm excitation. ICG was excited at 808 nm, and images were collected in the NIR-I (850–950 nm) and NIR-II (1000–1700 nm) region, respectively. g High-magnification (× 3) image of the ankle (red square in f), showing at least five collateral lymph vessels were resolved. h Cross-sectional fluorescence intensity profiles (black solid) and Gaussian fit (red dotted) along the yellow bar in g. i–l In vivo photobleaching studies of ICG and BTC1070. i, k Fluorescence images of lymphatic drainage at different time points post-injection using ICG i/BTC1070 k. 808 ( + )/1064 ( + ) represents that the 808/1064 nm laser irradiation was conducted according to the set on the time line (purple segments on orange lines, each segment in i represents 3 min) with the same fluence rate ( ~ 150 mW cm−2), whereas 808 (−)/1064 (−) represents no laser irradiation was conducted. Scale bar, 5 mm. j, l Fluorescence intensity signals of popliteal lymph nodes (green arrows/red arrows in i, k) versus time. Blue rectangles represent time windows of laser irradiation. Color bar ranges from 1000 to 30,000 for d–f,i, and k, 500–5000 for c, 2000–20,000 for g. The detailed imaging parameters for each image are listed in Supplementary Table 1. The bars represent mean ± s.d. derived from n = 3 biologically independent mice. Source data are provided as a Source Data file

