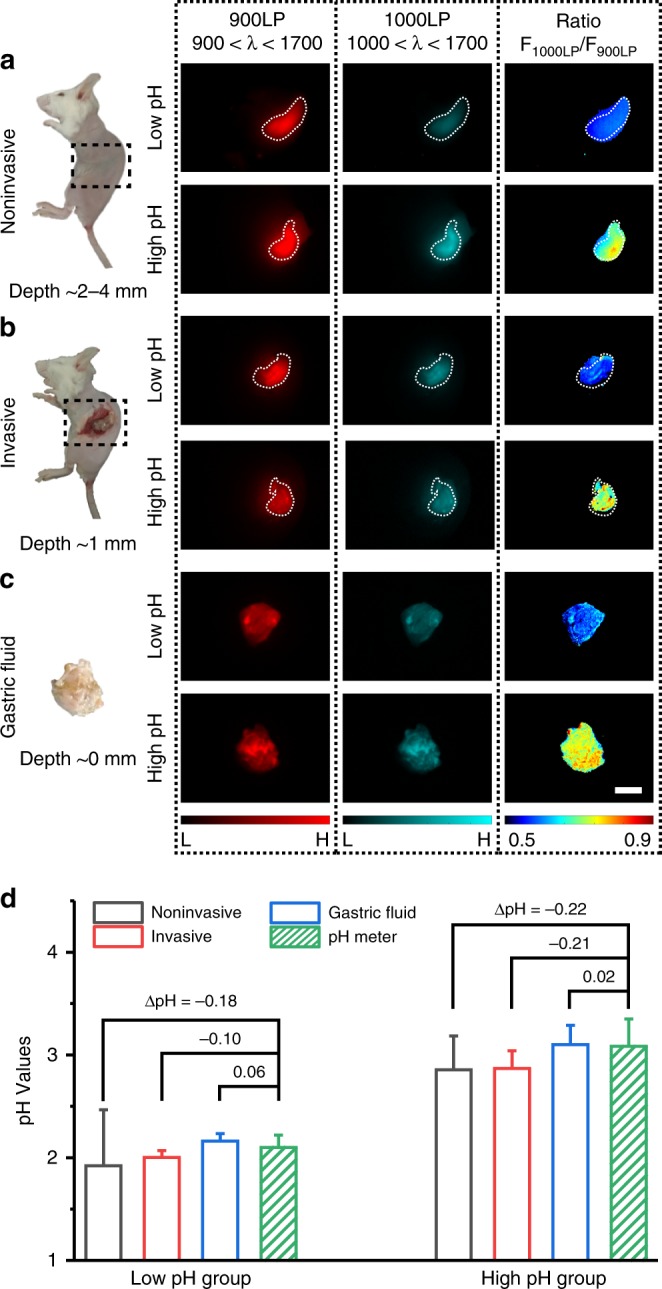
Fig. 7.

In vivo ratiometric fluorescence imaging of gastric pH. a–c Left: digital photographs of mice and dissected stomach denote three imaging modes. a noninvasive imaging at ~ 2–4 mm tissue depth; b invasive imaging of gastric fluid covered by ~ 1 mm thickness of gastric wall; c imaging of exposed gastric fluid. The measurement of tissue depth/thickness is shown in Supplementary Figure 24. Black dash square represents imaging window in mice. Right: fluorescence images and corresponding ratiometric fluorescence images of mice stomach at two different pH environments (red channel: 900–1700 nm; cyan channel: 1000–1700 nm; ratio channel: F1000LP/F900LP). Color bar ranges from 5000 to 30000 for the red/cyan channel in a and b, 0–30000 for the red/cyan channel in c. The detailed imaging parameters for each image are listed in Supplementary Table 1. Scale bar, 5 mm. d, Comparison of pH values in mice stomach measured by ratiometric fluorescence imaging and standard pH meter. The true gastric pH determined by pH meter is higher than that of simulated gastric fluid due to the buffering effect (see Methods). Ratios derived from the ratio images are converted to pH values by means of the calibration functions at corresponding depth (Supplementary Note 3). ΔpH = average pH resolved from ratiometric imaging−average pH measured by standard pH meter. Detailed pH data are summarized in Supplementary Table 7. Data point with its error bar stands for mean ± s.d. derived from n = 3 biologically independent mice. Source data are provided as a Source Data file
