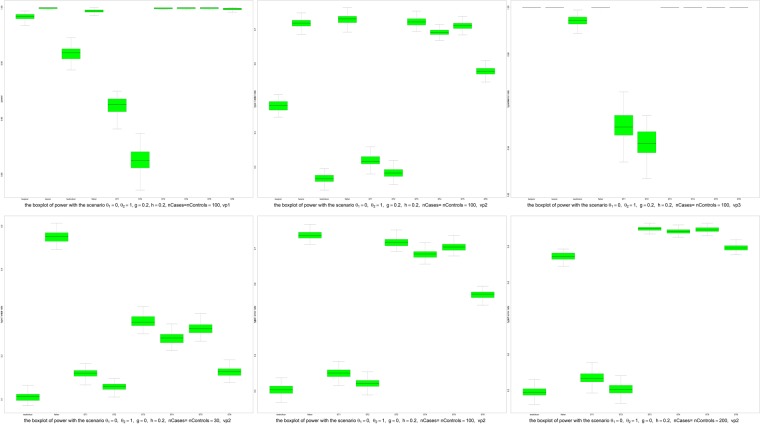
Figure 3.
Boxplots of powers. Upper left panel: the scenario with θ1 = 0, θ2 = 1, g = 0.2, h = 0.2, nCases = nControls = 100, vp1; Upper middle panel: the scenario with θ1 = 0, θ2 = 1, g = 0.2, h = 0.2, nCases = nControls = 100, vp2; Upper right panel: the scenario with θ1 = 0, θ2 = 1, g = 0.2, h = 0.2, nCases = nControls = 100, vp3; lower left panel: the scenario with θ1 = 0, θ2 = 1, g = 0, h = 0.2, nCases = nControls = 30, vp2; lower middle panel: the scenario with θ1 = 0, θ2 = 1, g = 0, h = 0.2, nCases = nControls = 100, vp2; lower right panel: the scenario with θ1 = 0, θ2 = 1, g = 0, h = 0.2, nCases = nControls = 200, vp2.

