Figure 3.
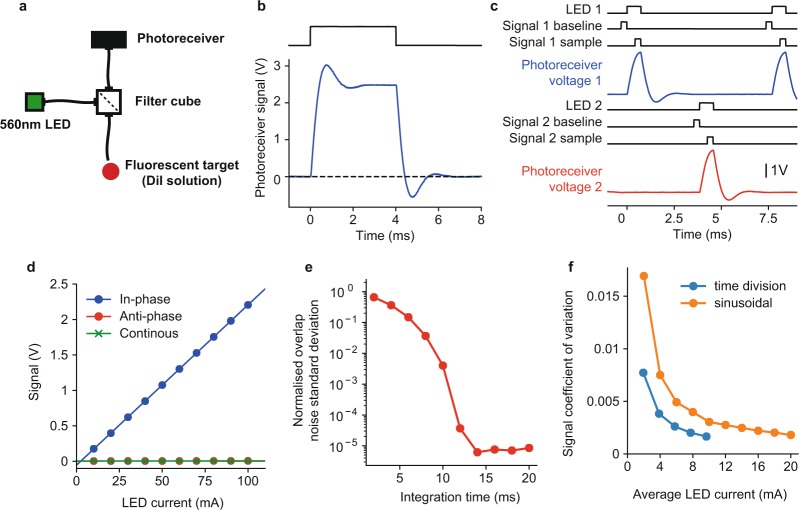
Time-division illumination. (a) Optical setup for testing time-division illumination and comparison with sinusoidal illumination. (b) Photoreceiver voltage response to 4 ms illumination light pulse. (c) Timing of events and photoreceiver voltage waveforms for time-division acquisition sequence at 130 Hz sampling rate. Black lines show timing of LED illumination and ADC reads of baseline and sample for signals 1 and 2. Blue and red lines show the photoreceiver voltage waveform due to fluorescence evoked by illumination of LEDs 1 and 2. (d) Baseline subtracted signal as a function of LED current for in-phase illumination, anti-phase illumination and continuous illumination of fluorescent target. (e) Numerical evaluation of the integration time required for orthogonality between sinusoidal modulations at 211 and 531 Hz. Orthogonality was quantified as the standard deviation of the overlap between the two sinusoids normalised by the average overlap of one sinusoid with itself - where overlap between two signals was defined as their product integrated over the time window. (f) Comparison of noise on signals obtained using sinusoidal illumination with lock-in amplification (orange) and time-division illumination with baseline subtraction (blue). Noise was quantified as the coefficient of variation (standard deviation divided by mean) of the signal, as a function of the average LED current.

