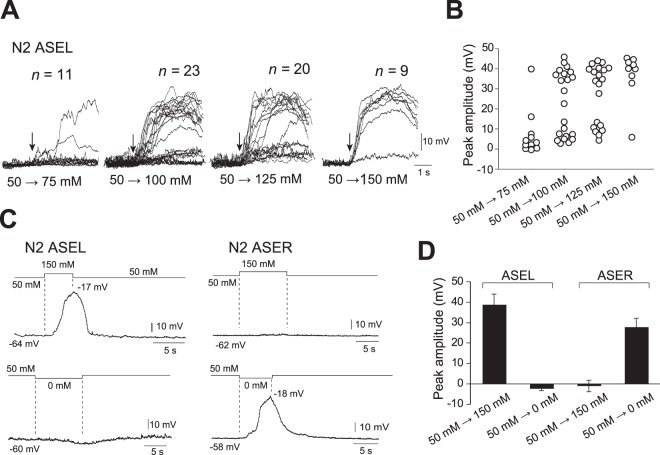
Figure 2.
Membrane depolarization evoked by application of various concentrations of NaCl to the nose tips of animals. (A) Membrane voltage traces of ASEL in response to 75 mM, 100 mM, 125 mM, or 150 mM NaCl. An experimental setting is shown in Fig. 1B. Vertical arrows indicate onset times of NaCl-evoked depolarization. Voltage traces from different animals were superimposed by synchronizing onset times at the same position. (B) Peak amplitudes, which are shown by circles, of membrane voltage traces shown in (A). (C) Membrane voltage traces of ASEL and ASER in response to application of 150 mM NaCl or NaCl-free buffer, respectively. Note that ASEL and ASER responded to increases and decreases of NaCl concentration, respectively. (D) Mean amplitudes of membrane voltage peaks in response to 150 mM NaCl or NaCl-free buffer (ASEL: n = 7 up-steps, n = 3 down-steps; ASER: n = 4 up-steps, n = 6 down-steps). Error bars, s.e.m.

