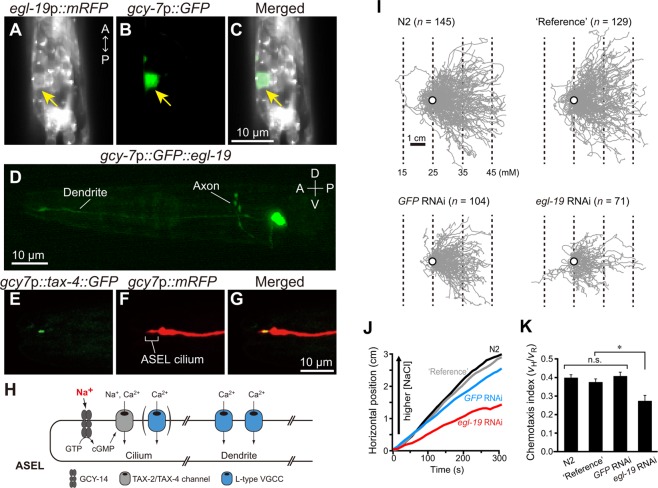
Figure 5.
EGL-19 produced in ASEL is required for chemotaxis. (A–D) Expression patterns of egl-19. (A) mRFP production under control of the egl-19 promoter. Note mRFP produced in ASEL as indicated by arrow. (B,C) GFP production under control of the gcy-7 promoter. Note specific production of GFP in ASEL. (D) Subcellular localization of the GFP::EGL-19 fusion protein produced under control of the gcy-7 promoter. Note specific localization of the fusion in ASEL dendrite, axon and cell soma. (E–G) Subcellular localization of the TAX-4 protein in ASEL. (E) TAX-4::GFP produced under control of the gcy-7 promoter. (F) mRFP under control of the gcy-7 promoter. (G) Merged image of (E,F). Note that TAX-4::GFP located in the chemosensory cilium, but not in dendrite, of ASEL. (H) Subcellular localization of membrane proteins involved in NaCl-induced signal propagation in the ASEL cilium and dendrite. (I) Trajectories of animals, wild-type N2, N2 producing GFP in ASEL and coelomocytes (‘Reference’), ‘Reference’ animals treated with GFP RNAi and ‘Reference’ animals treated with egl-19 RNAi, on chemotaxis assay plates with an NaCl linear gradient. Open circles indicate the starting position for all trajectories of individual animals during the initial 250 s. Dotted lines indicate NaCl concentrations calculated by assuming that the gradient is linear (5 mM NaCl/cm). (J) Mean horizontal positions of the four strains during the NaCl chemotaxis. (K) Effect of knock-down of EGL-19 specifically in ASEL by RNAi on chemotactic efficiency of animals toward preferred NaCl concentrations. Chemotaxis index vH/vR, which is horizontal velocity divided by velocity along the trajectory, was computed for each strain (see Materials and methods ‘Behavioral analysis’). Each data point represents the mean ± s.e.m. One-way ANOVA with Dunn’s post-hoc test was used for statistical analysis of the data. *p < 0.05. n.s., not significant.

