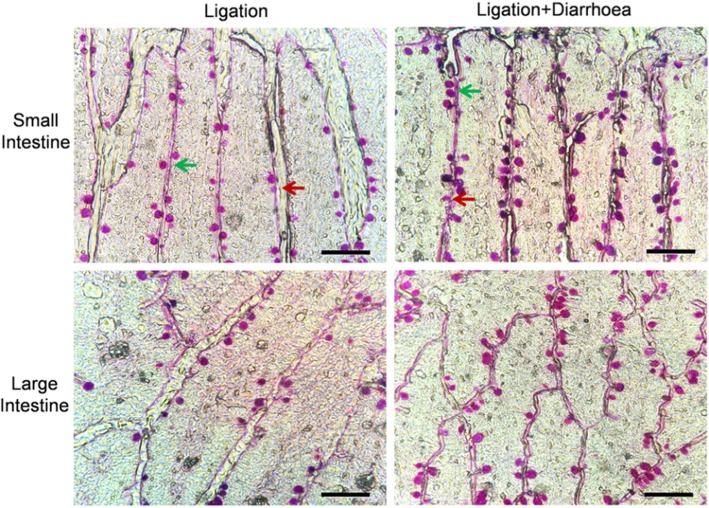
Fig. 6.
Photomicrographs of intestinal tissue stained with Alcian Blue/Schiff’s reagent to visualize goblet cells. Images are representative of mice treated with saline (Ligation groups) and senna leaf (ligation + diarrhea groups) with arrows indicating non-cavitated goblet cell (green arrow) and cavitated goblet cell (red arrow) secreting mucin. All bars are 100 μm

