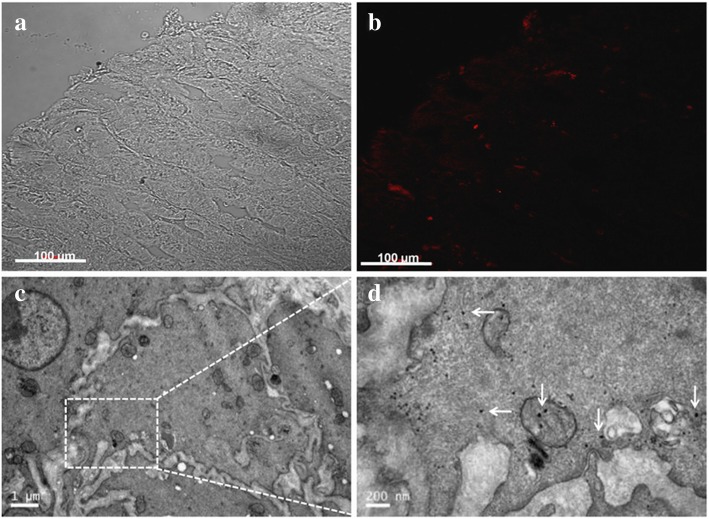
Fig. 9.
Distribution of nanoparticles in the gastric tissue. (a) and (b): Two-photo-laser scanning confocal microscopy images of intestinal tissue sections 7 days after tail vein injection of GNRs (Excitation: 780 nm, Emission: 601-657 nm). (c) TEM image of the gastric parietal cells; (d) Triangular silver nanoplates located in the gastric parietal cells (white arrows)

