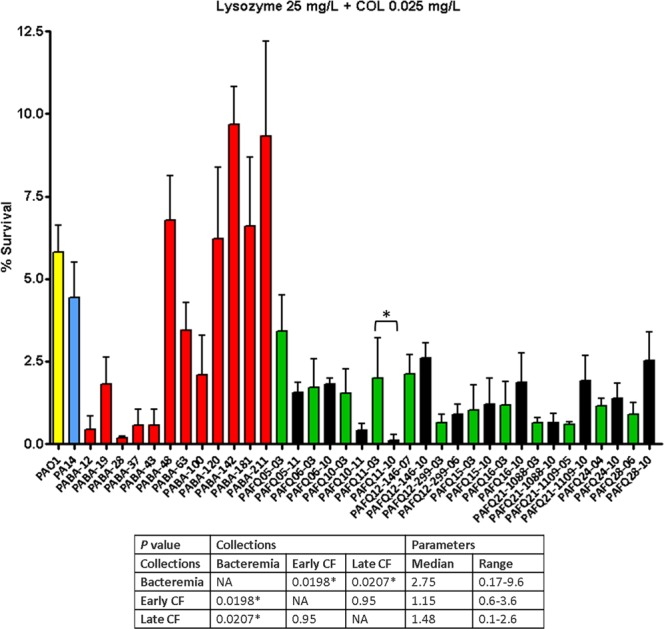
Figure 3.

Survival rates of the P. aeruginosa clinical strains after treatment with lysozyme + colistin (25 mg/L + 0.025 mg/L). Incubation was performed as explained in materials and methods (1 × 10⁶ CFUs of each strain, 37 °C, 180 r.p.m. agitation, 1 h), and the survival percentage was calculated with regards to the initial inoculum. Each column represents the mean value of at least three independent assays for each specific strain, whereas the error bar represents the standard deviation (SD). In the CF pairs of isogenic isolates, the green columns correspond to early and the black to late isolates, respectively. All the bacteremia strains are displayed with red columns. The asterisks over the bars indicate a statistically significant difference between the early/late isolates in the specific pair(s) of CF strains, P < 0.05 in the One-way ANOVA with post hoc Tukey’s multiple comparison test. The differences among bacteria treated with lysozyme + colistin and controls (bacteria incubated in the assay buffer without protein) were statistically significant in all the cases, with a slight growth in the control tubes (bacterial survival > 100%, P < 0.05, data not shown). The box below displays the statistical parameters obtained when analyzing the outcomes of the strains grouping them in the three collections (bacteremia, early CF isolates and late CF isolates). The performed t tests were two-tailed in all the cases; only when comparing the early with late CF isolates, a paired test was applied. *A P value < 0.05 was considered statistically significant regarding the differences among the mean values of collections. NA: Not applicable.
