
Figure 8.
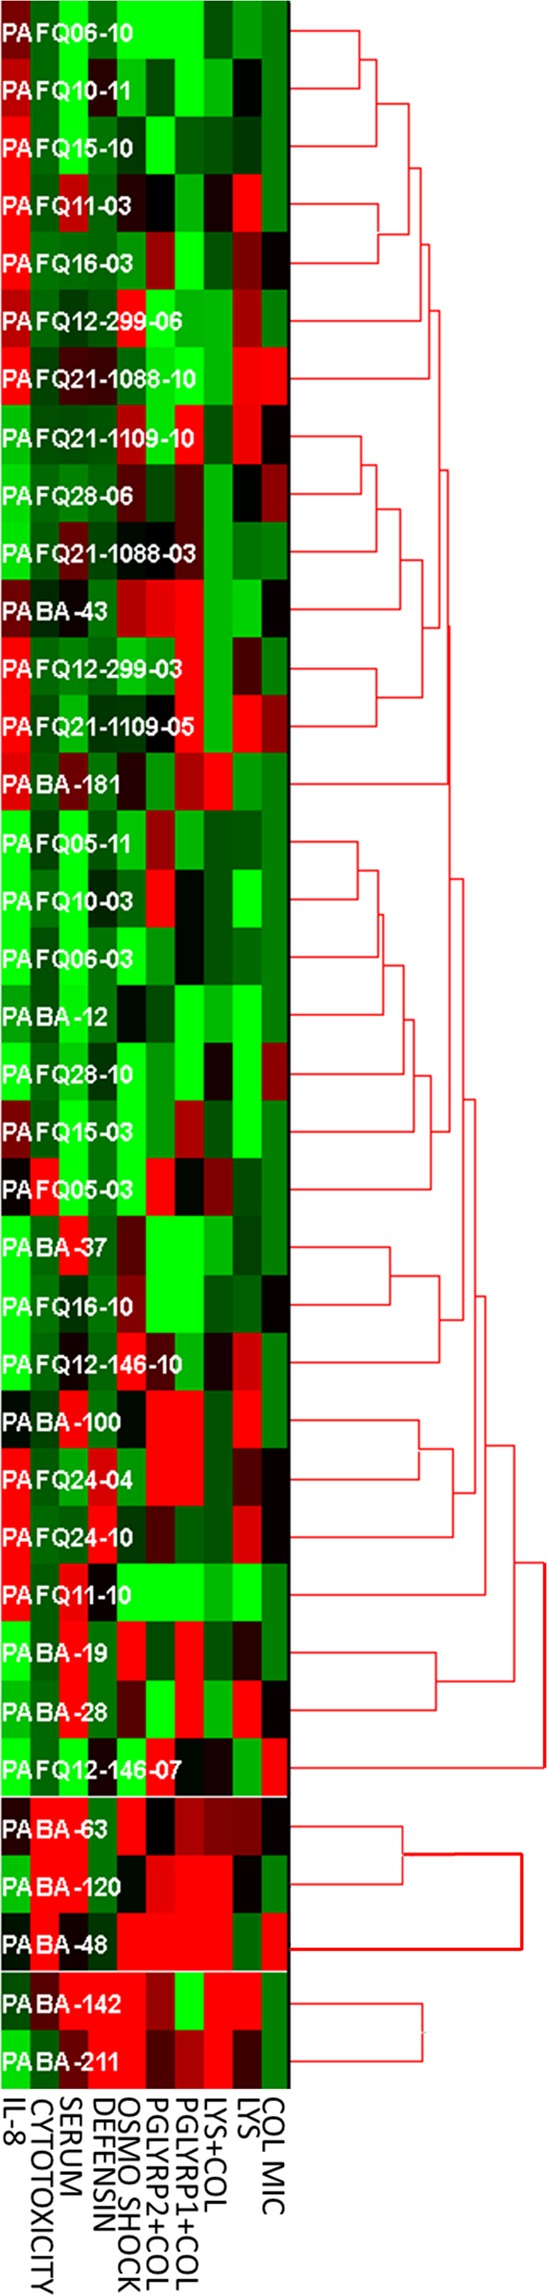
Hierarchical clustering of the strains according to the 10 measured variables showing statistically significant differences among strains (thus, the PGLYRPs treatments alone were not included). The values were normalized by Z-score, and the unsupervised hierarchical clustering (UPGMA, Euclidean distance, Minimum Similarity value = 0.5) was performed using the software HCE 3.5, available at http://www.cs.umd.edu/hcil/hce/ (University of Maryland). The lighter green and red are represented the squares, the lower and higher than the Z-score are the values, respectively. Therefore, the closer to black, the closer to 0 is the Z-score.