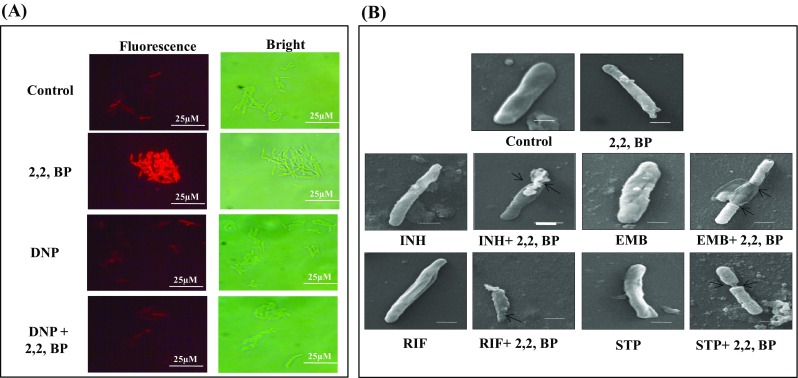
Fig. 1.

Effect of iron deprivation on membrane integrity and composition. a Fluorescence microscopy showing effect of energy depletion on PI uptake (red signal) in the absence (Control) and presence of 2,2,-BP (40 µg mL− 1) and DNP (ATP inhibitor) at ×100 magnification. Scale bar depicts 25 µm. b SEM images for MTB cells grown in the presence of drugs EMB, INH, RIF and STP with subinhibitory concentrations (0.00781 µg mL− 1, 0.0625 µg mL− 1, 0.03125 µg mL− 1 and 0.00781 µg mL− 1) alone showing smooth and filamentation of cell envelope. SEM images for MTB cells grown in the presence of drugs (EMB, INH, RIF and STP) with subinhibitory concentrations (0.00781 µg mL− 1, 0.0625 µg mL− 1, 0.03125 µg mL− 1 and 0.00781 µg mL− 1) along with 2,2,-BP (40 µg mL− 1) showing tampered morphology
