
Fig. 2.
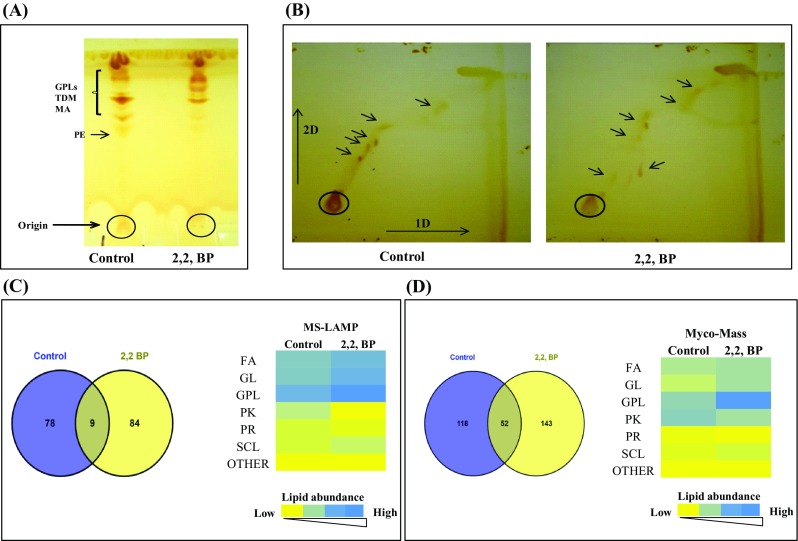
Lipid alteration under iron restriction. a Thin-layer chromatogram (TLC) showing alteration in total lipid profile under iron deprivation. b 2-D TLC of MTB (Control on left side) and 2,2,-BP (on right side) in presence of solvents as described in materials and methods. Arrows depict spots not detected under iron restriction. c Venn diagram showing the number of m/z values which were common and unique in MS-LAMP and heat map showing total lipid composition of major classes (FA, GL, GPL, PK, PR, SCL and others) in control and 2,2,-BP (treated) cells. Color bar depicts increasing number of lipid abundance from yellow to blue. d Venn diagram showing the number of m/z values which were common and unique in MycoMass and heat map showing total lipid composition of major classes (FA, GL, GPL, PK, PR, SCL and others) in control and 2,2,-BP (treated) cells. Color bar depicts increasing number of lipid abundance from yellow to blue