
Fig. 4.
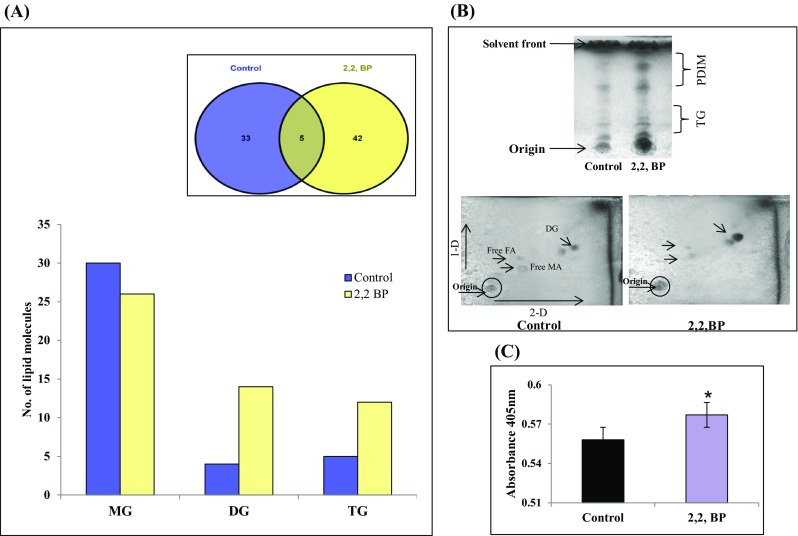
Changes in GL composition under iron deprivation. a Bar graph depicts number of lipid moieties identified from m/z values observed by Venn diagram at WR 1.0 through MS-LAMP. Inset (Venn diagram) showing the number of m/z values which were common and unique at WR 1.0. b Upper panel shows TLC of apolar lipids TG and PDIM extracted from control and 2,2,-BP cells. Lower panel shows 2D TLC of apolar lipids extracted from control and 2,2,-BP-treated cells. c Lipase activity depicted as bar graph in the absence (control) and presence of 2,2,-BP. Mean of O.D405 ± SD of three independent sets of experiments is depicted on Y-axis and *p value < 0.05