
Fig. 5.
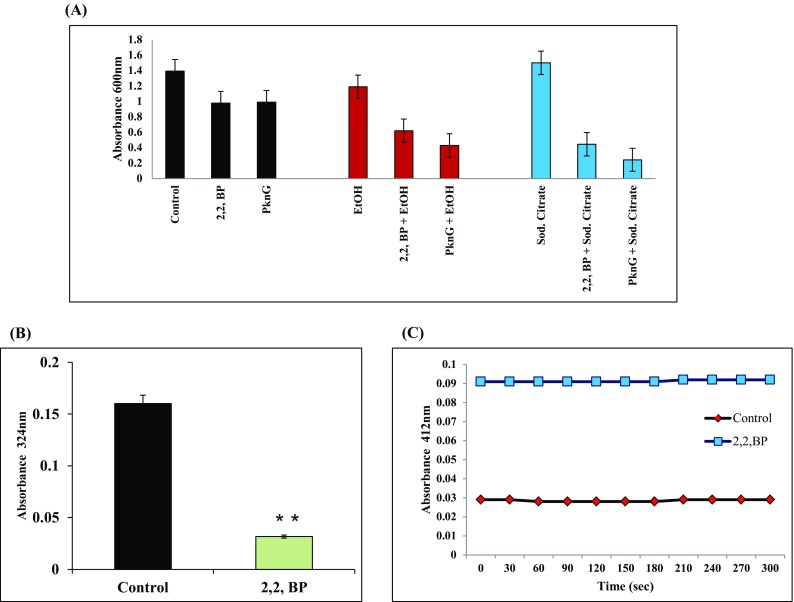
Effect of iron deprivation on metabolic stress (a). Effect of low carbon sources (0.2% of ethanol and 0.2% of sodium citrate) on MTB growth in iron-deprived condition and ΔPknG mutant. Mean O.D600 of three independent sets of experiments is depicted on Y-axis. b ICL activity depicted as bar graph. Mean of absorbance O.D324 ± SD of three independent sets of experiments is depicted on Y-axis and *p value < 0.05. c MS activity is depicted as graph. Mean of absorbance O.D412 ± SD of three independent sets of experiments is depicted on Y-axis