
Fig. 6.
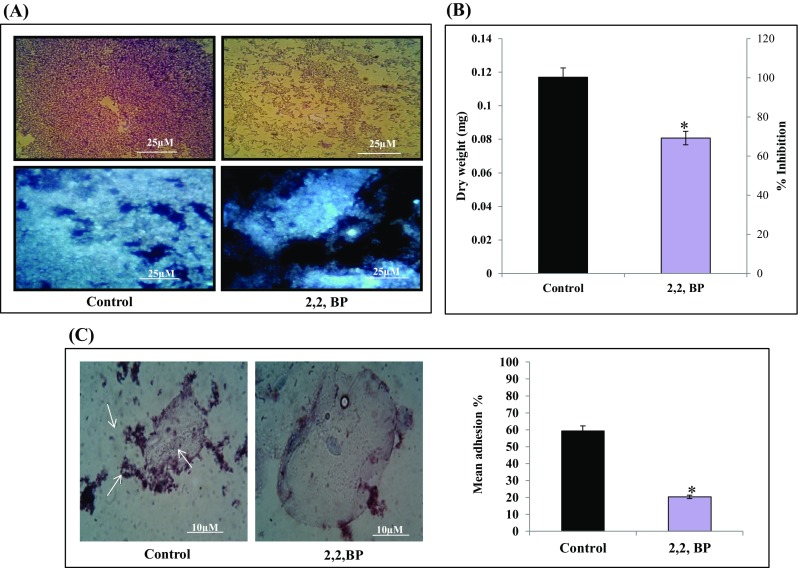
Effect of iron deprivation on MTB biofilm formation. a Biofilm formation depicted by CV staining (upper panel) and CFW staining (lower panel), respectively. b Biofilm biomass (dry weight) and metabolic activity are depicted by bar graph. Mean of biomass in mg ± SD and percentage inhibition, respectively, of three independent sets of experiments is depicted on Y-axis and *p value < 0.05. c Left panel showing Control (untreated) cells appeared adhered (depicted by arrow) to human buccal epithelial cells while iron-deprived cells (2,2,-BP) are not adhered to the epithelial cells (magnification ×40). Right panel showing mean percentage adherence of MTB cells depicted as bar graph showing O.D600 ± SD of three independent sets of experiments on Y-axis and *p value < 0.05