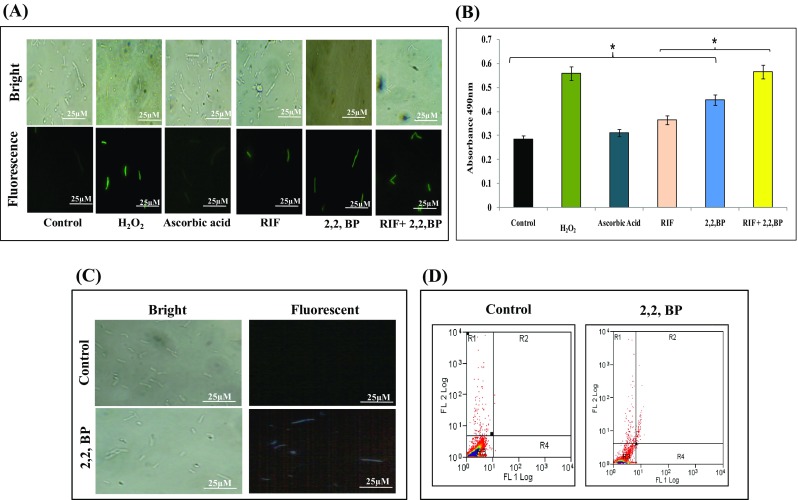
Fig. 8.

Effect of iron deprivation on oxidative stress. a Estimation of ROS generation with DCFDA observed by fluorescence microscope at ×100 magnification. Scale bar depicts 25 µm. b ROS quantification under iron restriction with INT dye. Mean of absorbance O.D490 ± SD of three independent sets of experiments is depicted on Y-axis and *p value < 0.05. c Fluorescence microscopy of DAPI staining for the detection of DNA damage in the presence of 2,2,-BP at ×100 magnification. Scale bar depicts 25 µm. d Flow cytometry of control and 2,2,-BP (40 µg mL− 1)-treated MTB cells depicting necrosis and apoptosis-like events
