
Fig. 9.
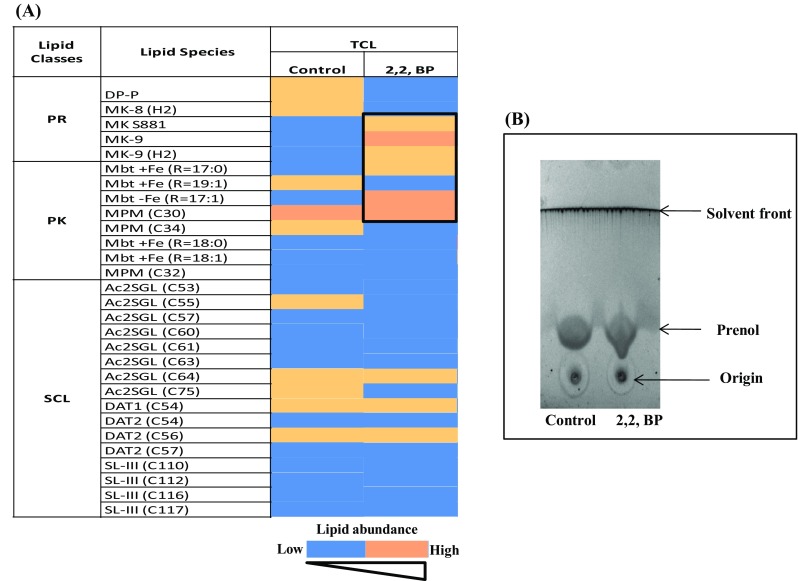
Changes in minor lipid classes under iron deprivation. a Heat map representing composition of (PR, PK and SCL) of MTB control and 2,2,-BP-treated cells present at WR 1.0, through MS-LAMP. Data are shown by color bar depicting increasing number of lipid abundance from yellow to blue. b TLC showing lipid profiling of prenol under iron deprivation