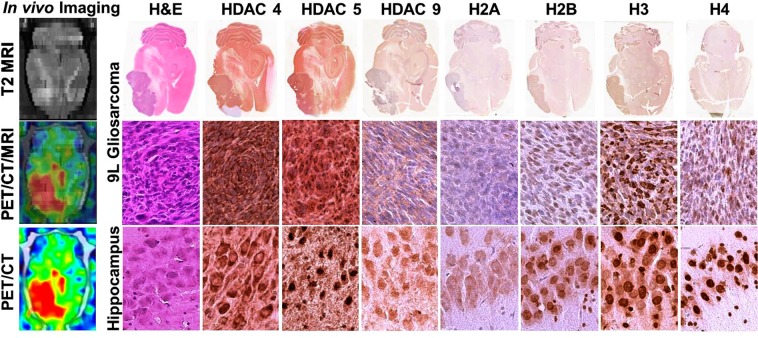
Figure 2.
Comparative analysis of [18F]TFAHA PET/CT/(MRI) and immunohistochemical (IHC) staining in 9L glioma and in the contralateral hippocampus. The left column: (top) axial T2-weighted MR image; (middle) corresponding axial PET/CT/(MRI) fusion image; (bottom) corresponding axial PET/CT image. Macroscopic (top row) and microscopic images (x200) of axial brain sections stained with H&E and by IHC to visualize the levels of expression of HDACs 4, 5, 9, and acetylation of histones H2AK5ac, H2BK5ac, H3K9ac, and H4K8ac in 9L tumor (middle row) and in contralateral hippocampal CA2 (bottom row). PET/CT images are color-coded to standard uptake values (SUV).

