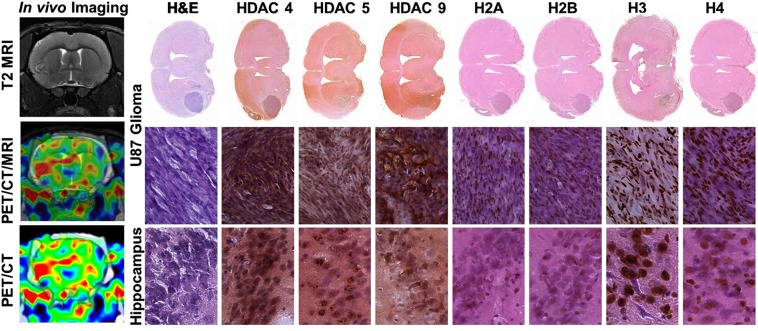
Figure 3.
Comparative analysis of [18F]TFAHA PET/CT/(MRI) and immunohistochemical (IHC) staining in U87-MG glioma and in the contralateral hippocampus. The left column: (top) coronal T2-weighted MR image; (middle) corresponding coronal PET/CT/(MRI) fusion image; (bottom) corresponding coronal PET/CT image. Macroscopic (top row) and microscopic images (x200) of axial brain sections stained with H&E and by IHC to visualize the levels of expression of HDACs 4, 5, 9, and acetylation of histones H2AK5ac, H2BK5ac, H3K9ac, and H4K8ac in U87-MG tumor (middle row) and in contralateral hippocampal CA2 (bottom row). PET/CT images are color-coded to standard uptake values (SUV).

