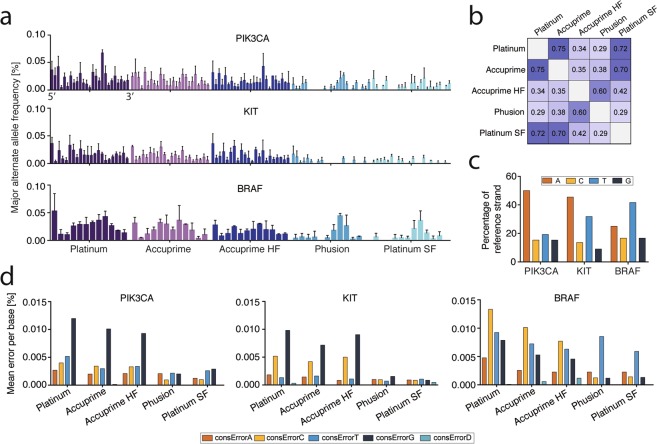
Figure 2.
Sequence dependent errors. (a) Comparison of consensus10 error at each base using different polymerases in the barcoding PCR step. Mean ± SD is shown (n = 3). (b) Spearman’s correlation coefficient between error frequencies by base position and different polymerases using different polymerases in barcoding PCR. All correlations are significant (p < 0.05). (c) Base composition of the reference strand in each amplicon. (d) Mean consensus10 error in each amplicon by nucleotide change relative to the reference sequence. For example, consErrorG of 0.01% reflects that 0.01% of bases were changed to a G from any of the other bases. The observed pattern is congruent with expected polymerase-induced errors based on the base composition of each amplicon. consErrorD denotes deleted bases. HF, High Fidelity; SF, SuperFi.

