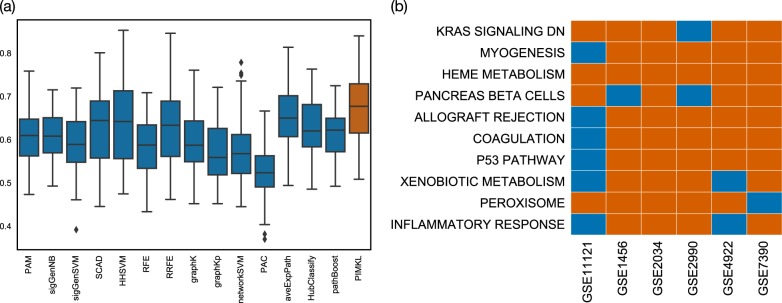
Fig. 1.
PIMKL cross-validation results. a Box plots for AUC values over all cohorts for the methods considered. PIMKL results are reported in red, while other methods results are colored in blue. Box plots are obtained from ten (repeats of) mean AUC values over 10-fold cross-validation splits, see Algorithm S1. b Heat map showing significant pathways selected by PIMKL across the different cohorts considered in the study. Significant pathways are highlighted in red, while non-significant are colored in blue

