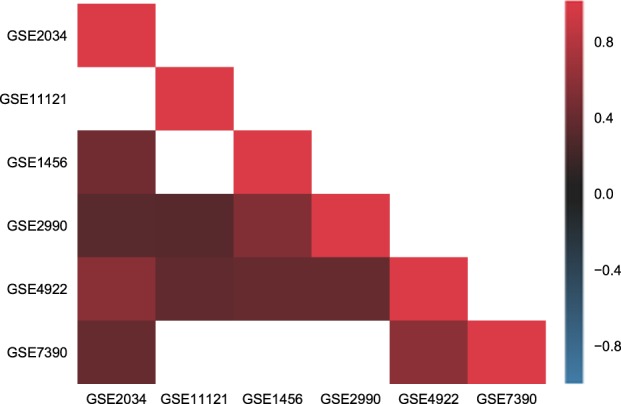
Fig. 2.

Correlation in molecular signatures. Heat map reporting the correlation of the molecular signature estimated across multiple cohorts. Correlation values are reported in the lower triangular part of the heat map (since it is symmetric) on blue to red scale, where white squares indicate non-significant correlations. All cohorts exhibit a positive correlation, significant in most cases, proving the stability of the molecular signature obtained with PIMKL
