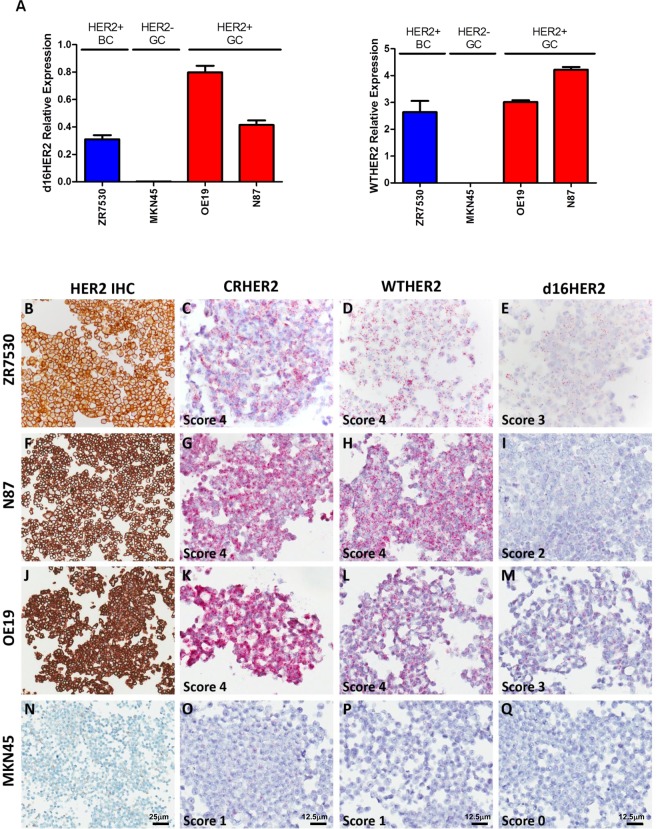
Figure 1.
d16HER2 and WTHER2 isoform detection in HER2-positive BC (ZR75.30), GC (N87) and Oesophago-gastric (OGC) (OE19) and HER2-negative GC (MKN45) cell lines evaluated using qPCR, immunohistochemistry (IHC) and mRNA bright-field in situ hybridization (ISH) analyses. (A) qPCR analysis of relative d16HER2 and WTHER2 expression; (B–Q) HER2 expression by IHC and WTHER2 and d16HER2 isoforms detection by mRNA ISH. The ZR75.30 cell line (B–E) exhibits positive HER2 IHC reactivity (B); CRHER2 and WTHER2 mRNA ISH (score 4) (C,D); d16HER2 mRNA ISH (score 3) (E). The N87 cell line (F,G,H,I) exhibits positive HER2 IHC reactivity (F); CRHER2 and WTHER2 mRNA ISH (score 4) (G,H); d16HER2 mRNA ISH (score 2) (I). The OE19 cell line (J–M) exhibits positive HER2 IHC reactivity (J); CRHER2 and WTHER2 mRNA ISH (score 4) (K,L); d16HER2 mRNA ISH (score 3) (M). The MKN45 cell line (N,O,P,Q) exhibits negative HER2 IHC reactivity (N); CRHER2 and WTHER2 mRNA ISH (score 1) (O,P); d16HER2 mRNA ISH (score 0) (Q). Original magnification: 20 × (B,F,J,N; scale bar: 25 μm) and 40 × (C–Q; scale bar: 12,5 μm).

