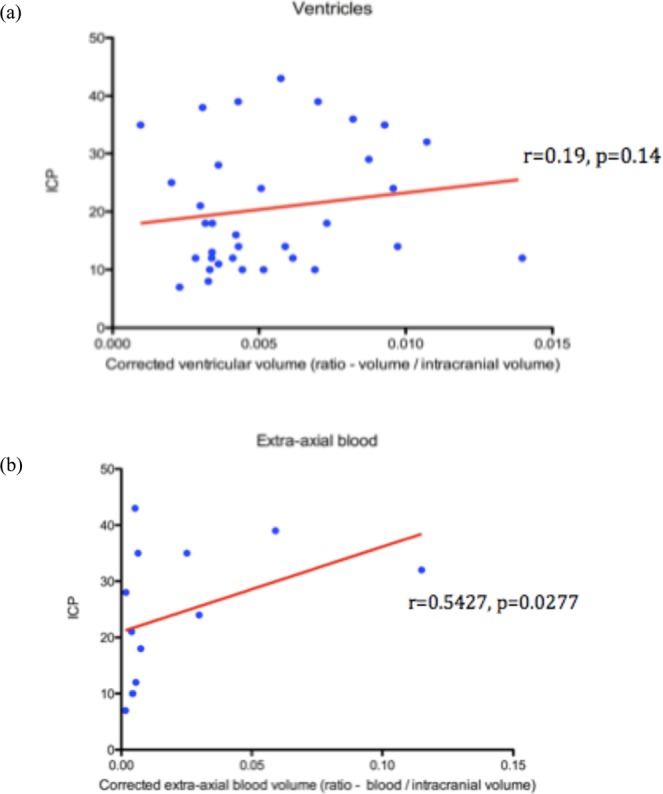
Figure 3.

Ventricular and extra-axial blood associations with ICP. (a) The mean corrected ratio of ventricular volume in the cohort was 0.00552. There was no significant correlation between ventricular volume and initial ICP (r = 0.19, p = 0.14). (b) The mean corrected ratio of extra-axial blood volume, in the sub-cohort (n = 13) demonstrating this feature, was 0.0207. No significant correlation was noted between corrected extra-axial blood volume and initial ICP (r = 0.54, P = 0.03).
