Figure 1.
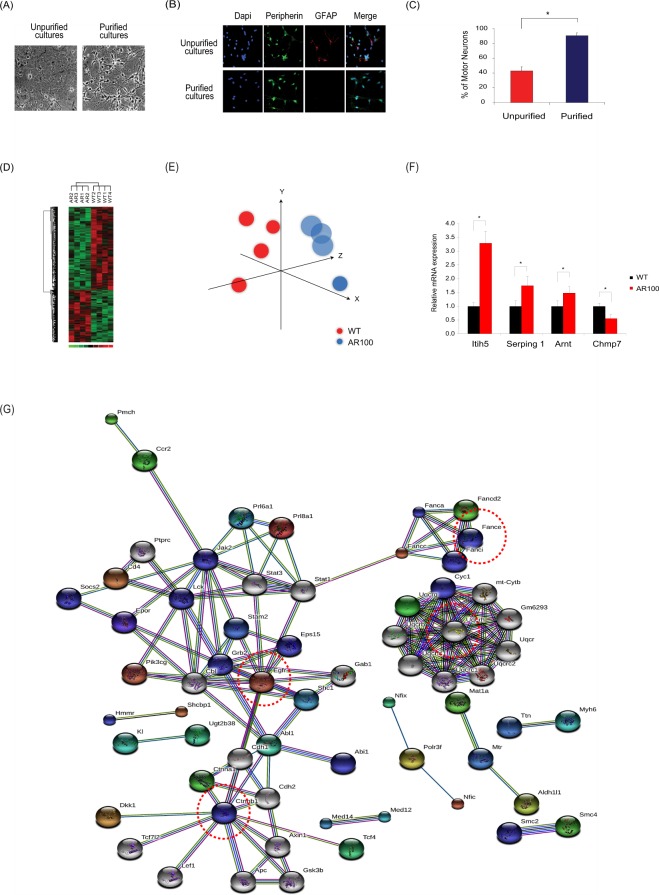
Transcriptomic profiling and gene expression analysis of primary motor neurons of SBMA mice. (A) Phase contrast pictures of purification of motor neuron cultures using Optiprep density centrifugation. (B) Immunostaining of cultures with peripherin (a marker of motor neurons in ventral horn cultures) and GFAP (astrocytes) was used to establish the number of motor neurons in culture. (C) Cell counts of cultures confirmed that 90% of cells are labelled as motor neurons after the purification protocol. (D) Cultured embryonic motor neurons treated with DHT from SBMA and wild-type (WT) mice have distinct transcriptional profiles. Principal component analysis (PCA) of gene expression data groups WT profiles together and distinct from AR100 data. (E) Similar findings were observed with hierarchical clustering of significant genes. (F) TaqMan qPCR was performed to determine expression of mRNA expression of indicated genes. Itih5, Serping 1, Arnt and Chmp7 were dysregulated in AR100 DHT treated motor neurons relative to WT (n > 3, *P < 0.05). Data are displayed as mean ± SEM and are representative of independent experiments from three replicate cultures. Statistical analysis was performed using a two sample t-test (n ≥ 3, *P < 0.05). (G) String protein-protein network (PPI) was built using the significant gene list. The network was built around EGFR, UQCRC1, FANCE and CTNNB1 (circled by red dotted line). The generated networks represent associations between proteins. The colour of the lines represents different categories of evidence: neighbourhood in the genome (dark green line), gene fusion (red line), co-occurrence across genomes (dark blue line), co-expression (black line), experimental/biochemical data (purple line), association in curated databases (light blue line) and occurrence in text mining evidence (light green line).

