Figure 3.
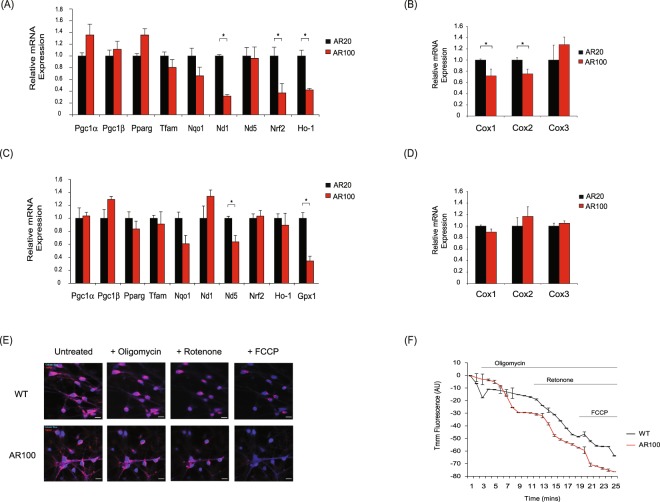
Dysregulation of mitochondrial genes and disruption of mitochondrial membrane potential in SBMA mice. (A) The expression of mitochondrial associated genes was established by qPCR in E13 AR100 and control AR20 motor neurons cultures. (B) The expression of cytochrome c oxidase subunit genes, Cox1 and Cox2 was reduced in AR100 E13 motor neurons, with no significant change in Cox3. (C) Mitochondrial genes were also examined in spinal cord of 3 month old presymptomatic AR100 and control AR20 mice. (D) Cox1, Cox2 and Cox3 mRNA expression was not altered in AR100 presymptomatic mice. Data are displayed as mean ± SEM and are representative of three independent experiments. Statistical analysis was performed using a two sample t-test (n ≥ 3, *P < 0.05). (E) Mitochondrial membrane potential (ΔΨm) of embryonic motor neurons treated with DHT was determined by live cell imaging of AR100 and AR20 motor neurons using TMRM. Live cell imaging was performed by recording images continuously from a single focal plane. Mitochondria were loaded with TMRM and motor neurons were labelled with 1 nM calcein-blue AM. (F) The effect of mitochondrial toxins (oligomycin, rotenone and FCCP) was measured in a time series experiment. AR100 motor neurons became strongly depolarised after addition of the toxins. Scale bars represent 10 µM. Data are displayed as mean ± SEM and are representative of at least three independent experiments. Statistical analysis was performed using a repeated measures ANOVA followed by the Bonferroni post hoc test (n ≥ 4, *P < 0.05). AU = arbitrary units.

