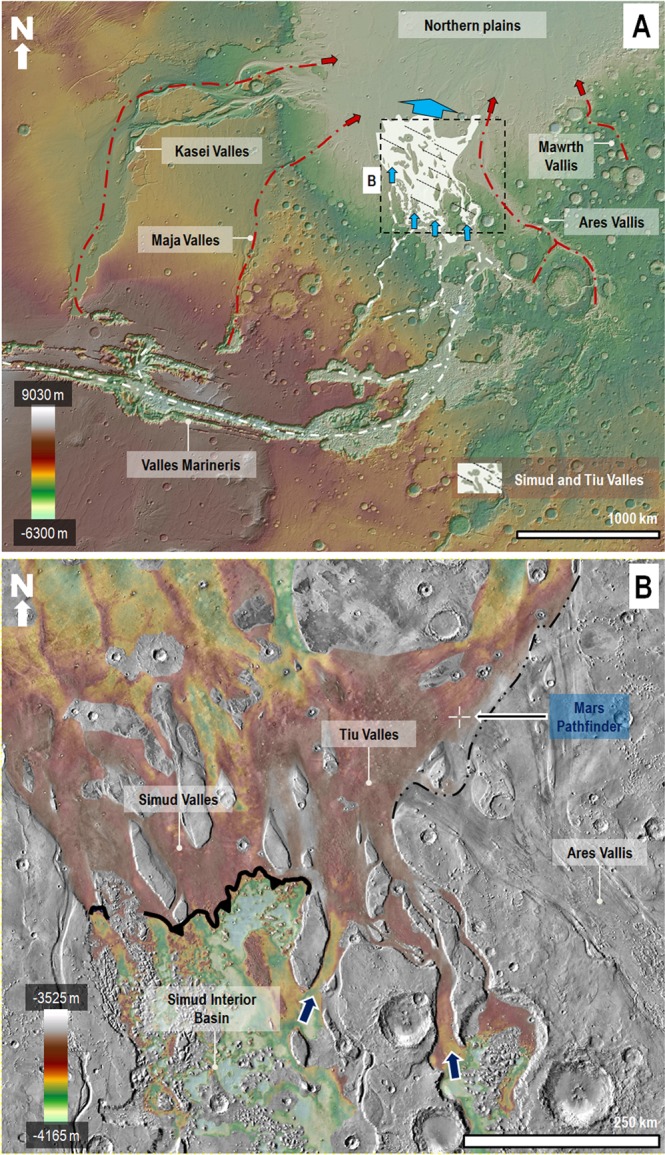
Figure 1.

(A) View of Mars’ western hemisphere centered at 2°20′34″N, 49°51′57″W. The dashed white lines trace the planet’s largest canyon network, which includes the circum-Chryse outflow channels and Valles Marineris. This network converges into the northern lowlands (blue arrows) via Simud and Tiu Valles (area highlighted in white). The red lines and arrows indicate other circum-Chryse outflow channels, which are not part of the network. The base image for panel A is a color-coded shaded-relief Mars Orbiter Laser Altimeter (MOLA) digital elevation model (DEM) (460 m/pixel). Credit: MOLA Science Team, MSS, JPL, NASA. (B) View showing the topographic transition between the floors of the Simud Interior Basin (SIB) and the Simud/Tiu Valles system. See panel A for the view’s context and location. We removed from the DEM prominent topographic features such as impact craters, chaotic terrains, and teardrop-shaped islands to better resolve the broad-scale elevation changes that characterize the transition. The contact between the SIB and Simud Valles forms a south-facing break in slope that closely follows an elevation of −3,800 m (indicated by an indented black line). On the other hand, the contact between the SIB and Tiu Valles consists of two canyons (blue arrows) that exhibit reversed topographic gradients with approximate overflow elevations at −3,700 m (western canyon) and −3,550 m (eastern canyon). The contact between Ares and Tiu Valles is an erosional unconformity (dashed black line)3,14. The crosshair symbol shows the location of the Mars Pathfinder landing site. The elevation ranges are from MOLA-extracted topography (460 m/pixel). Credit: MOLA Science Team, MSS, JPL, NASA. The base image for panel B is part of a Thermal Emission Imaging System (THEMIS) Day IR (infrared) 100 m Global Mosaic (http://www.mars.asu.edu/data/). Credit: Christensen et al.61. We produced the mosaic areas and maps in this figure using Esri’s ArcGIS® 10.3 software (http://www.esri.com/software/arcgis).
