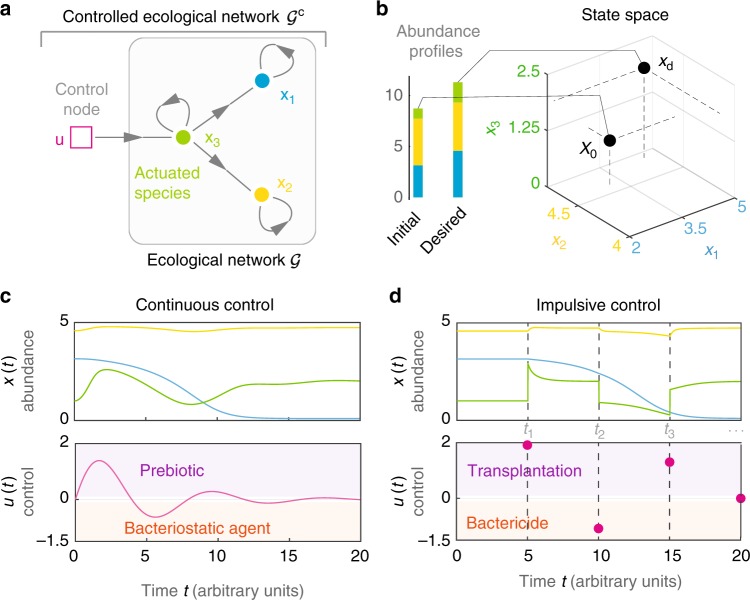
Fig. 1.
Controlling a microbial community. a Ecological network for a toy microbial community of N = 3 species (green, yellow, blue). The controlled ecological network contains M = 1 control input actuating the third species. b Initial and desired abundance profiles (bars). Controlling the community consists in driving its state from the initial state x0 to the desired state xd, represented by two points in the state space of the community. c In the continuous control scheme, the control inputs u(t) are continuous signals modifying the growth of the actuated species. The controlled population dynamics of this community is given by , , . In the absence of control, this community has two equilibria and , chosen as the initial and desired states, respectively. d In the impulsive control scheme, the control inputs u(t) are impulses applied at the intervention instants , instantaneously changing the abundance of the actuated species. The controlled population dynamics is the same as in panel (c), except that and x3(t+) = x3(t) + u(t) if . Under this controlled population dynamics, our mathematical formalism identifies x3 as the solo driver species needed to drive this microbial community (Example 1 in Supplementary Note 2)

