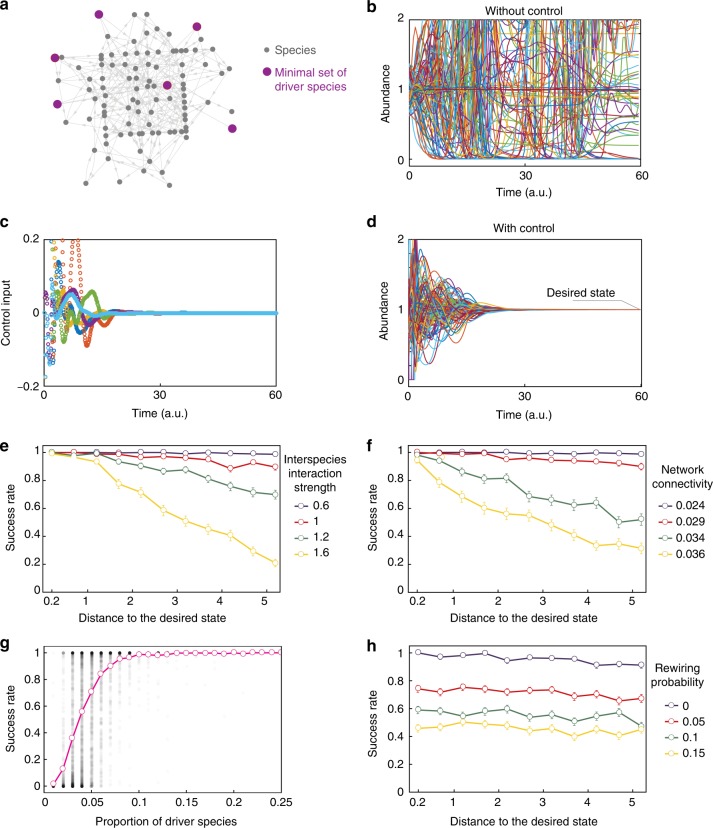
Fig. 5.
Numerical validation on large microbial communities. a Example of the ecological network for a random microbial community with N = 100 species (c = 0.03). A minimum set of M = 6 driver species is shown in purple. The desired state is chosen as . b With a random initial abundance x0 at distance d = 0.4 from the desired state, the uncontrolled microbial community does not reach xd. c, d For the same community and initial abundance as in panel (b), we apply the control input generated by the linear MPC (panel c) to the six identified driver species. This control strategy drives the community to xd (panel d). e, f, h Mean success rate as a function of d. Error bars denote the standard error of the mean. Parameters are: c = 0.025, θmax = 0.05 for panel (e), σ = 0.8, θmax = 0.05 for panel (f), and c = 0.025, σ = 0.8, θmax = 0.05 for panel (h). g Success rate as function of the proportion M/N of driver species. Black dots show the success rate of 7700 random communities. Pink shows the mean success rate

