Fig. 2.
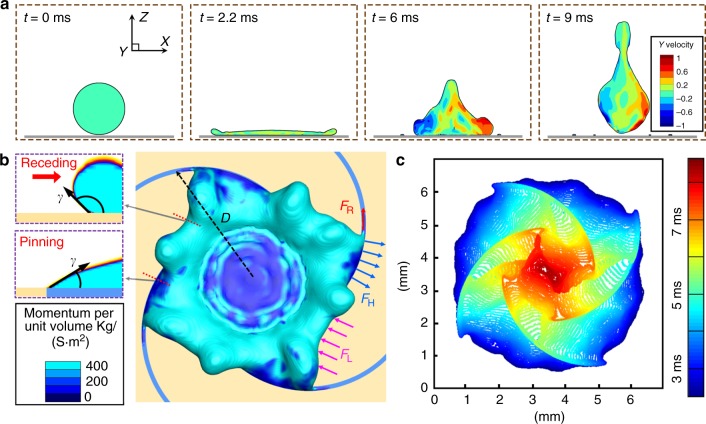
Mechanical analysis of the droplet gyration. a Simulated results to show the out-of-plane velocity distribution in the cross-section of the droplet at typical stages of before contact (t = 0 ms), maximum spreading (t = 2.2 ms), receding (t = 6 ms), and departing from the solid (t = 9 ms). b Force model to analyze the origin of the droplet gyration motion. A symmetric unit is used for the analysis due to its symmetry. θL and θH are the contact angles of the liquid film on the low-adhesive region and the high-adhesive spiral region, as shown by the simulated cross-sections. The driving forces from the solid to the liquid contain the force on the low-adhesive region (FL, γcosθL per unit length, as marked by the pink arrows) and the force perpendicular to the high-adhesive spiral (FH, γcosθH per unit length, as marked by the blue arrows). Meanwhile, the liquid film remained on the high-adhesive spiral brings resistance to the droplet rotating (FR, γ per unit length, as marked by the red arrows). D is the maximum spreading radius of the impacting droplet. The color shows the distribution of the momentum per unit volume. c Contours of the three-phase contact lines at different time of the retraction reveal that the liquid on the low-adhesive region recedes faster than that on high-adhesive spirals throughout the retraction process

