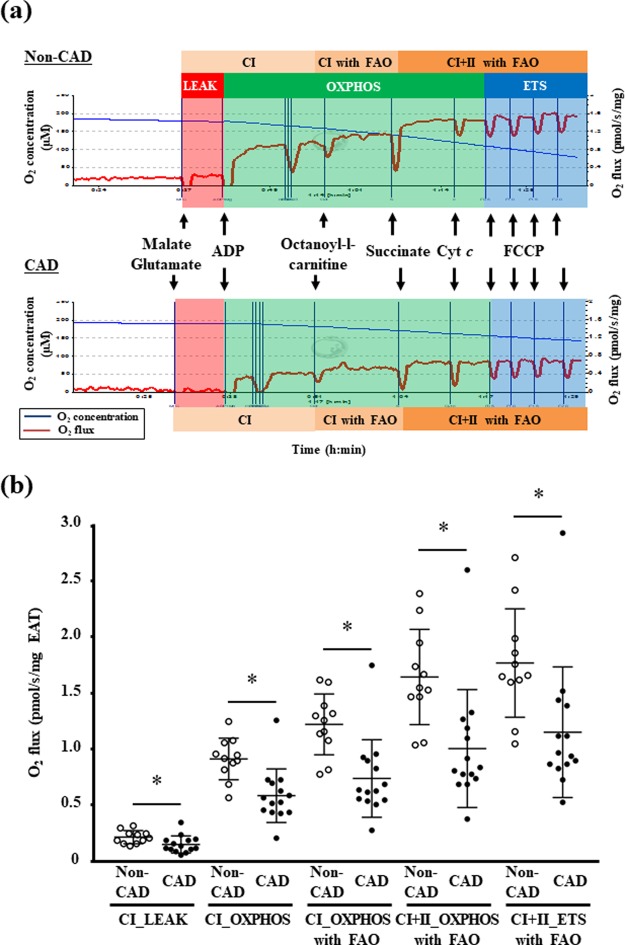
Figure 1.
The mitochondrial respiratory capacity in the EAT. (a) Representative graphs of mitochondrial respiratory capacity in the EAT in the non-coronary artery disease (non-CAD, n = 11) and CAD patients (n = 14). (b) The mitochondrial respiratory capacity at each state with non-fatty acid and fatty acid substrates in the EAT was lowered in the CAD group. Bar: mean ± SD. *P < 0.05. CI, complex I-linked substrates; CI + II, complex I + II-linked substrates; ETS, maximal electron transfer system capacity; FAO, fatty acid oxidation; LEAK, leak-state respiration (non-ADP stimulated respiration); OXPHOS, oxidative phosphorylation capacity (ADP-stimulated respiration).

