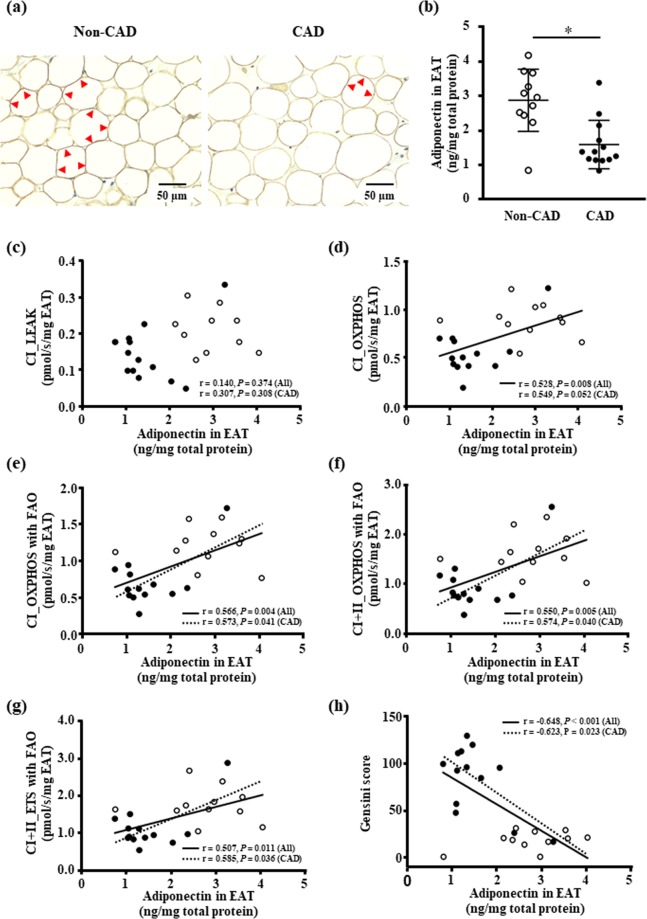
Figure 3.
The protein content of adiponectin in the EAT. (a) Representative images of immunohistochemical staining of adiponectin in the EAT of the non-CAD and CAD patients. Adiponectin is stained in dark brown in the cytosol around the lipid droplet in the adipocyte of the EAT (see red arrows), and intensity of adiponectin staining appears to be weak in a CAD patient compared to a non-CAD patient. (b) The protein levels of adiponectin in EAT in non-CAD (n = 11) and CAD patients (n = 13). Bar: mean ± SD. *P < 0.05. (c–g) The association the protein content of adiponectin and the mitochondrial respiratory capacity in the EAT. (h) The association between the protein content of adiponectin and the severity of coronary artery stenosis. White and black circles indicate non-CAD (n = 11) and CAD patients (n = 13), respectively. A solid line indicates a significant correlation in all patients and a dashed line indicates a significant correlation only in CAD patients. Abbreviations are explained in the Fig. 1 legend.

