Fig. 1.
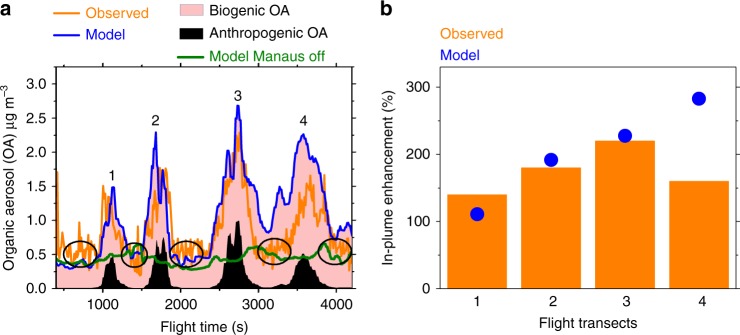
Aircraft measurements and model predictions demonstrating large OA enhancements within the urban plume compared to the pristine Amazonian background. a Total organic aerosols (OA) measured along aircraft flight transects at 500-m altitude on March 13 (orange) and model-predicted OA for simulations with all emissions on (blue), and biogenic emissions on but Manaus emissions off (green, representing background OA), as described in the text. The shaded regions depict simulated biogenic and anthropogenic OA components. b Measured and model predicted average percent enhancement in plume compared to background organic aerosol on 4 different flight transects, as marked in a. The figure shows four different transects when the aircraft intersected the Manaus plume marked as 1–4, while background (outside plume) concentrations are ~0.5 μg m−3, indicated by the open circles. Bars represent measurements while symbols represent model-predicted increases of OA within Manaus plume compared to background conditions

