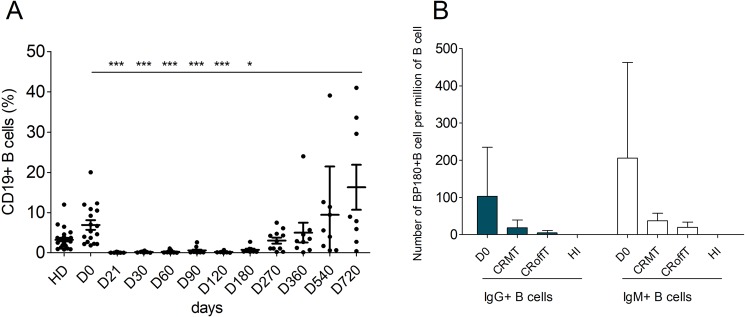
Figure 3.
Evolution of blood B cells in BP patients treated with rituximab. Panel A: Percentage of total CD19+ B cells (Kruskal-Wallis test Dunn’s comparison relative to day 0). Panel B: Number of BP180-specific B cell IgM+ (white bars) or IgG+ (blue bars) in BP patients at day 0, in BP patients in complete remission off therapy (CRoffT) or on minimal therapy (CRMT) at Month 24, and in healthy individuals (HI) (Mann Whitney T-Test).

