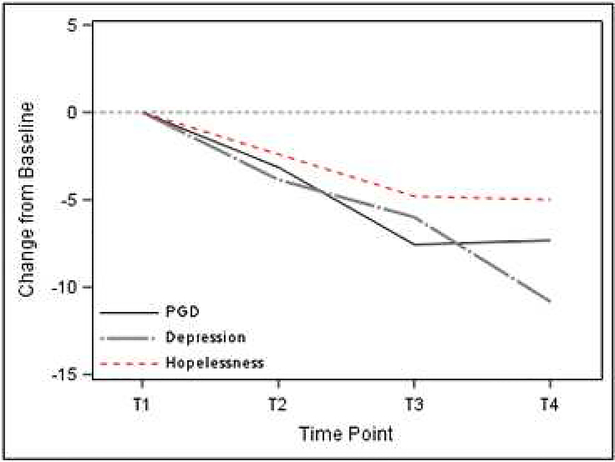
Figure 1. Changes in prolonged grief, depression, and hopelessness over time.
Note. The figure depicts mean change in each measure, at each timepoint, relative to baseline. Pairwise complete data are used to maximize sample size, thus not all participants included for T2 analysis were available for T3 and T4 analysis. For interpretation of size of effects, see individual measure ranges in Table 1. PGD = Prolonged grief symptoms. T1 = Pre-intervention. T2 = Mid-intervention. T3 = Post-intervention. T4 = 3 months post-intervention.

