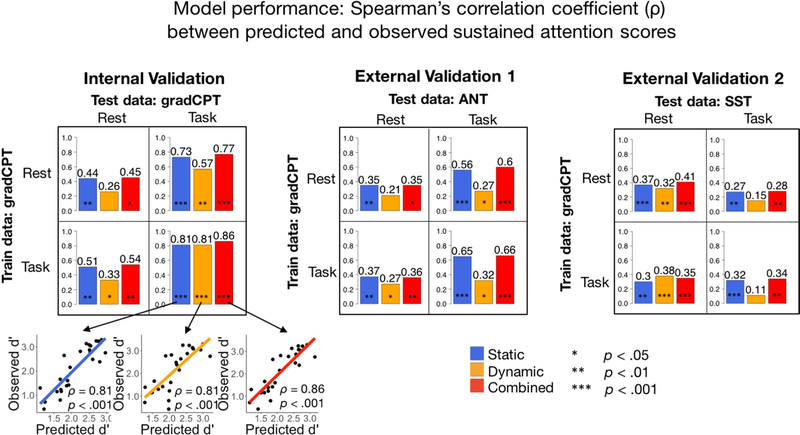
Figure 2: Prediction performance of static, dynamic and combined FC models across task across datasets.
Bar levels and values indicate Spearman’s ρ between predicted d’ and observed behavior score (d’ in gradCPT, response time variability in ANT, and go-rate in SST). Statistical significance is assessed with a 1000-iteration permutation test detailed in the Methods section. See Table 1 for more detailed performance and significance metrics.

