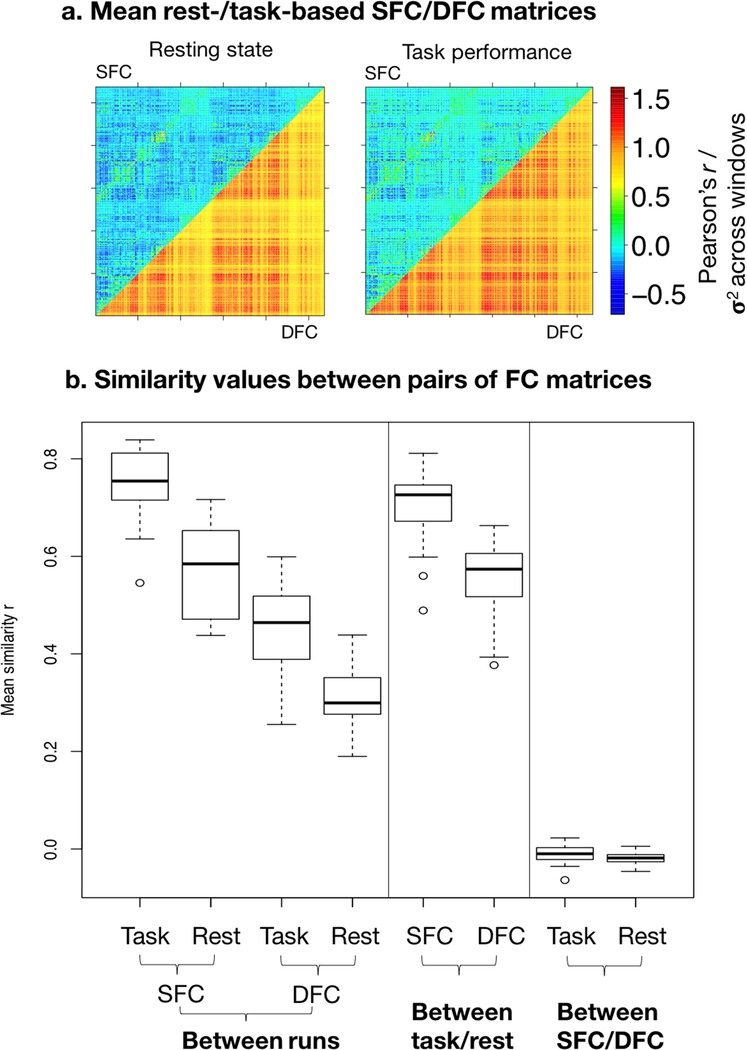
Figure 3: a. Mean static and dynamic functional connectivity matrices across subjects.
In both figures, the upper triangle contains entries from the mean SFC matrix across subjects, which are Fisher-z transformed Pearson’s r values; the lower triangle contains entries from the mean DFC matrix, which are variability (σ2) values of Fisher-z transformed Pearson’s r values across sliding windows, upscaled by 3× for better visual display. Left: resting-state matrix; right: task-based matrix. The diagonal is excluded as it spans the connections of nodes to themselves. By definition, static matrices include both positive and negative values, while dynamic matrices include only positive values. b. Mean similarity between FC measures within subjects. Similarity is quantified by Pearson’s r, and boxplot shows distribution of similarity across individuals. From left to right – 1. between task-based SFC matrices across scan runs, 2. between resting-state SFC matrices across runs, 3. between task-based DFC matrices across runs, 4. between resting-state DFC matrices across runs, 5. between task-based and resting-state SFC matrices, 6. between task-based and resting-state DFC matrices, 7. between resting-state SFC and DFC matrices, 8. between task-based SFC and DFC matrices.

