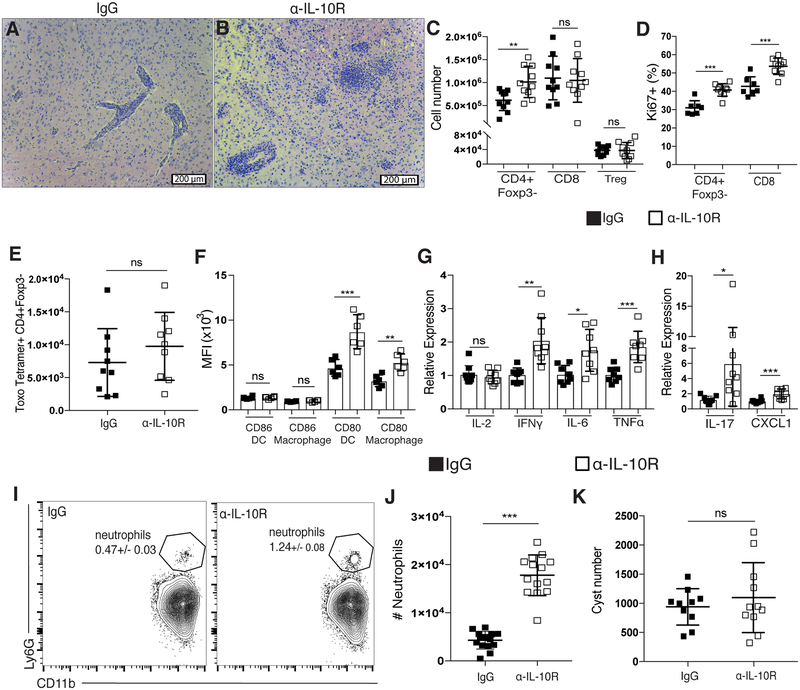
Figure 1. Blockade of IL-10R during chronic T. gondii infection leads to broad changes in the immune response and fatal immunopathology in the brain.
(A-K) Rat IgG or an α-IL-10R blocking antibody was administered to chronically infected mice beginning at day 28 post-infection. (A-B) Representative H&E stained brain sections from a chronically infected control-treated mouse (A) and an α-IL-10R-treated mouse (B). (C) T cells isolated from the brain were analyzed by flow cytometry. Effector CD4+ T cells (CD4+Foxp3-), CD8 T cells, and Tregs (CD4+Foxp3+) were enumerated (n=5 per group, data is pooled from two independent experiments and analyzed using a randomized block ANOVA). (D) The frequency of Ki67+ effector T cells was measured by flow cytometry from mononuclear cells isolated from the brains of control and α-IL-10R-treated mice (n=3–5 per group, data is pooled from two independent experiments and analyzed using randomized block ANOVA). (E) Parasite-specific CD4+ effector T cells were assessed by flow cytometry using an MHCII-peptide tetramer. (F) The mean fluorescence intensity (MFI) of CD80 and CD86 on brain-infiltrating APCs. DCs were gated on CD45hiCD3−NK1.1−CD19−CD11c+MHCIIhi live singlet cells and macrophages were gated on CD45hiCD3−NK1.1−CD19−CD11c−CD11b+ live singlet cells (n=6 per group, data is representative of 3 independent experiments and analyzed using Student’s t test). (G-H) qRT-PCR was done using mRNA isolated from whole brains of chronically infected control or α-IL-10R-treated mice. Relative expression was normalized to the control (IgG-treated) group (n=4–5 per group, data is pooled from two independent experiments and analyzed using randomized block ANOVA). (I) Representative flow plots showing the neutrophil population isolated from the brains of chronically infected mice. Neutrophils were gated on CD45hiCD3−CD19−NK1.1−CD11b+Ly6G+ live singlet cells. Number in plot indicates the mean frequency ± standard error. (J) Neutrophils were identified by flow cytometry from cells isolated from the brains of chronically infected control or α-IL-10R-treated mice (n=4–5 per group, data is pooled from three independent experiments and analyzed by randomized block ANOVA). (K) Total cyst numbers from the brains of chronically infected control and α-IL-10R-treated mice were counted using light microscopy (n=3–4 per group, data is pooled from three independent experiments and analyzed by randomized block ANOVA). * denotes p<0.05, ** denotes p<0.01, and *** denotes p<0.001 for all panels.

